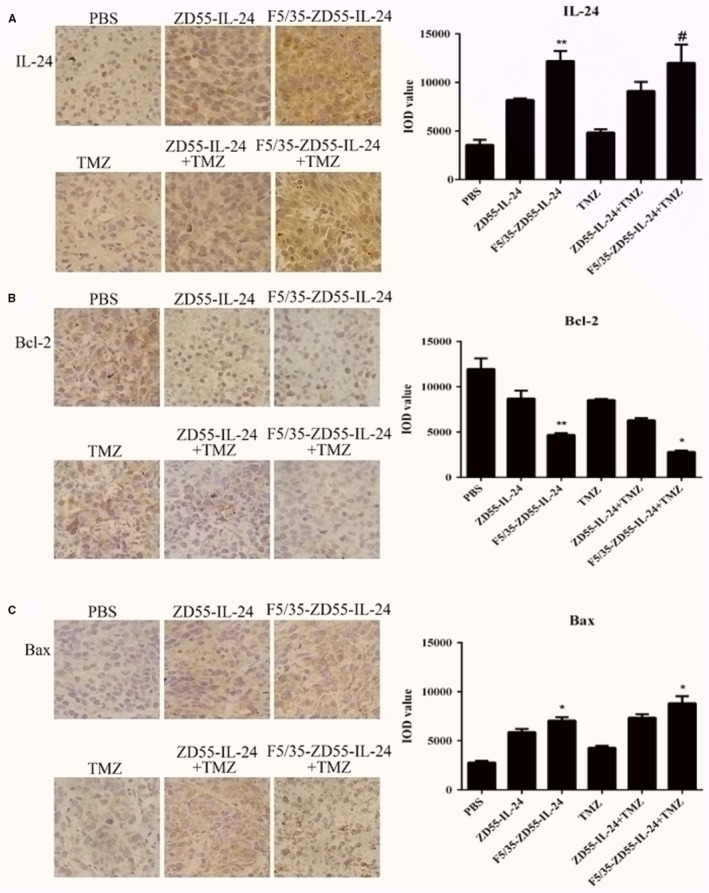
Figure 8.

Immunohistochemistry for IL‐24, Bcl‐2, and Bax protein levels in vivo. A, Immunohistochemistry and quantification for IL‐24. B, Immunohistochemistry and quantification for Bcl‐2. C, Immunohistochemistry and quantification for Bax. Original magnification, 400× (scale bar, 25 μm). IOD: integral optical density. *P < 0.05 and **P < 0.01, F5/35‐ZD55‐IL‐24 vs ZD55‐IL‐24, F5/35‐ZD55‐IL‐24 + TMZ vs F5/35‐ZD55‐IL‐24; # P > 0.05 vs F5/35‐ZD55‐IL‐24
