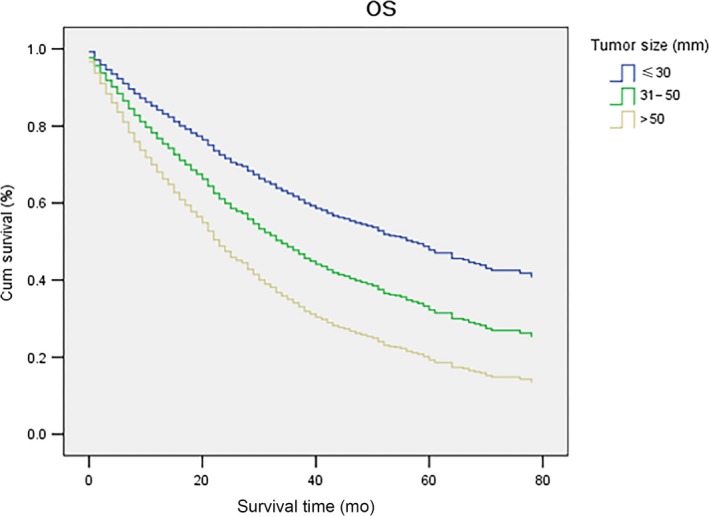
Figure 2.

Adjusted OS of patients with solitary HCC by tumor size (≤30 mm/31‐50 mm/>50 mm) in the whole study population. Compared with tumors ≤30 mm, tumors between 31‐50 mm had inferior adjusted OS in multivariate analyses (AHR and 95% CI: 1.53 [1.35‐1.75]), and tumors >50 mm also showed worse adjusted OS in multivariate analyses (AHR and 95% CI: 2.23 [1.94‐2.56]). HCC, hepatocellular carcinoma; OS, overall survival; AHR, adjusted hazard ratio; CI, confidence interval
