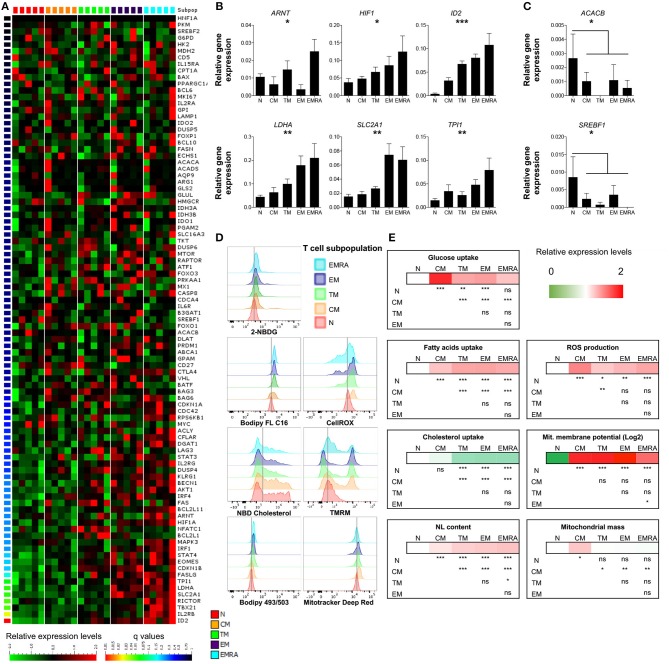
Figure 1.
Basal energetic requirements of distinct CD8+ T-cell subsets. (A) Heatmap showing the gene expression profile (according to q-value) of resting CD8+ T-cell subsets. N (CCR7+, CD45RA+, CD27+); CM (CCR7+, CD45RA−, CD27+); TM (CCR7−, CD45RA−, CD27+); EM (CCR7−, CD45RA−, CD27−); EMRA (CCR7−, CD45RA+, CD27−). N = 5. (B,C) Relative mean expression of metabolism-related genes with significant differences among T-cell subsets (B) or in comparisons of N vs. the whole memory compartment (C). N = 5. (D,E) Representative examples (D) and heatmaps showing relative mean expression levels (E) of various metabolic properties measured by flow cytometry (glucose uptake with 2-NBDG; FA uptake with Bodipy FL C16; cholesterol uptake with NDB cholesterol; neutral lipid (NL) content with Bodipy 493/503; ROS production with CellROX; mitochondrial membrane potential with TMRM; mitochondrial mass with Mitotracker Deep Red). N = 10. Statistical significance was determined using a one-way paired ANOVA with Bonferroni's post-test (A–C) or a paired Student's t-test (E). *P < 0.05, **P < 0.01, ***P < 0.001; ns, not significant.

