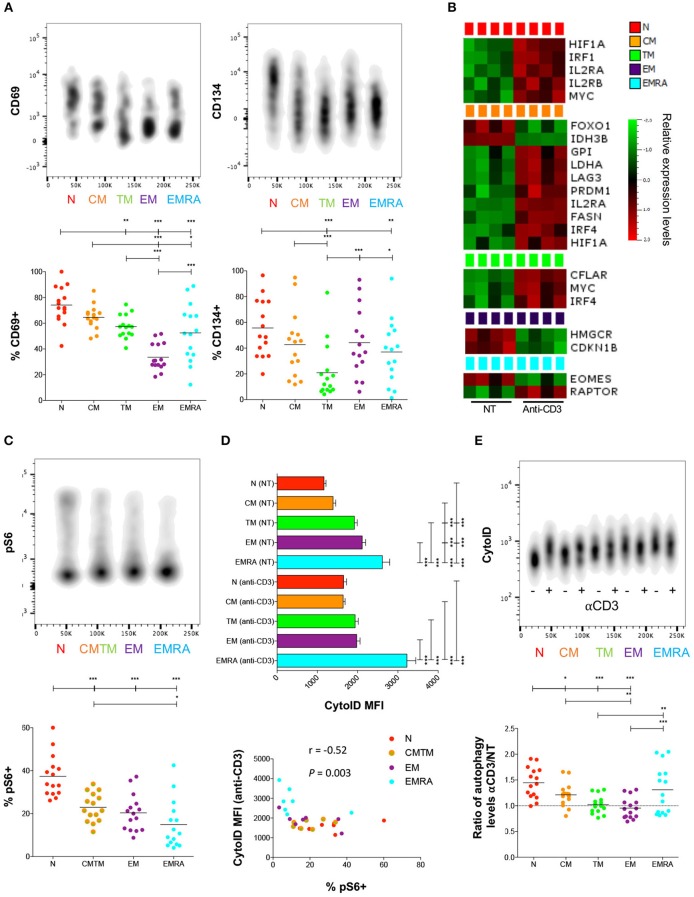
Figure 2.
Metabolic switch in activated naïve CD8+ T-cells. (A) PBMCs were activated with plate-bound αCD3. Expression of CD69 and CD134 was measured by flow cytometry after 3 h and 24 h, respectively. Upper panels: one representative example is shown for each stain. Lower panels: horizontal lines depict mean values. N = 15. (B) Heatmap showing significant differences in gene expression between resting (NT) and αCD3-activated CD8+ T-cells after 3 h. N = 4. (C) PBMCs were activated with plate-bound αCD3. Expression of pS6 was measured by flow cytometry after 3 h. Upper panel: one representative example is shown. Lower panel: horizontal lines depict mean values. N = 15. (D) PBMCs were activated with plate-bound αCD3. Autophagic activity was measured by flow cytometry after 24 h. Upper panel: autophagic activity in resting (NT) or αCD3-activated CD8+ T-cells. Error bars depict mean ± SEM. Lower panel: correlation between autophagy and mTOR activity upon activation. N = 15. (E) PBMCs were activated with plate-bound αCD3. Activation-induced autophagic activity is shown as a ratio (αCD3/NT). Upper panel: one representative example is shown. Lower panel: horizontal lines depict mean values. N = 15. Statistical significance was determined using a one-way paired ANOVA with Bonferroni's post-test (A,C–E), a paired Student's t-test (B), or Spearman's rank correlation (D). *P < 0.05, **P < 0.01, ***P < 0.001.

