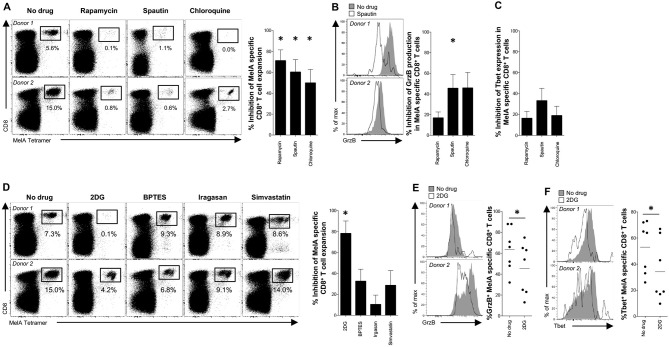
Figure 4.
Engagement of autophagy and mTOR during antigen-specific priming of naïve CD8+ T-cells. (A–F) MelA-specific naïve CD8+ T-cells were primed in the absence or presence of various metabolic inhibitors. (A,D) MelA-specific CD8+ T-cells were quantified by flow cytometry after 10 days using cognate PE-conjugated ELA/HLA-A2 tetramers. Left panels: representative data are shown as dot plots. Right panels: percent inhibition of expansion is shown as mean ± SEM. (B,E) Expression of granzyme B in primed MelA-specific CD8+ T-cells was measured by flow cytometry after 10 days. Left panels: representative data are shown as histogram plots. Right panel (B): percent inhibition of granzyme B expression is shown as mean ± SEM. Right panel (E): percent expression of granzyme B is shown. Horizontal lines depict mean values. (C,F) Expression of Tbet in primed MelA-specific CD8+ T-cells was measured by flow cytometry after 10 days. (C) Percent inhibition of Tbet expression is shown as mean ± SEM. Left panel (F): representative data are shown as histogram plots. Right panel (F): percent expression of Tbet is shown. Horizontal lines depict mean values. Statistical significance was determined using the Wilcoxon signed rank test (A–F). N = 7 (A–C); N = 8 (D); N = 7 (E,F). *P < 0.05.

