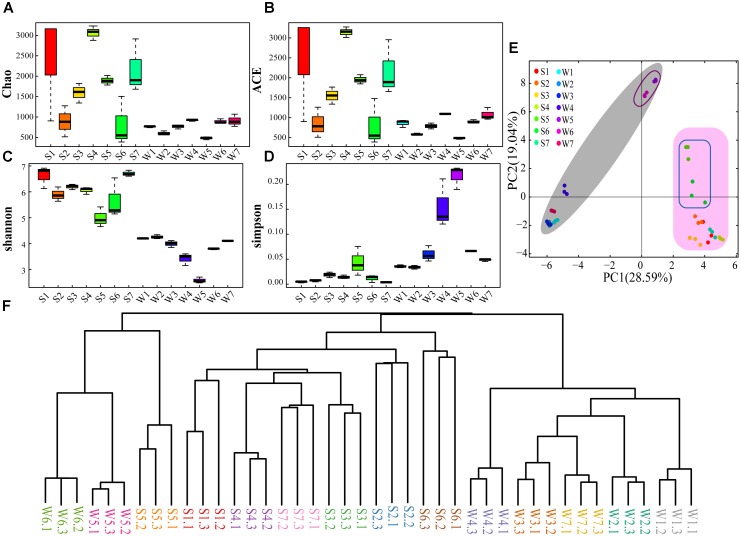
FIGURE 2.
The diversity and phylogenetic structure of community composition. Sampling was performed at different sites for three times. W, Water samples; S, sediment samples. (A) Chao index. (B) ACE index. (C) Shannon index. (D) Simpson index. (E) PCA of the water and sediment samples based on the analysis of OTUs. (F) Bray-Curtis cluster tree of the water and sediment samples.

