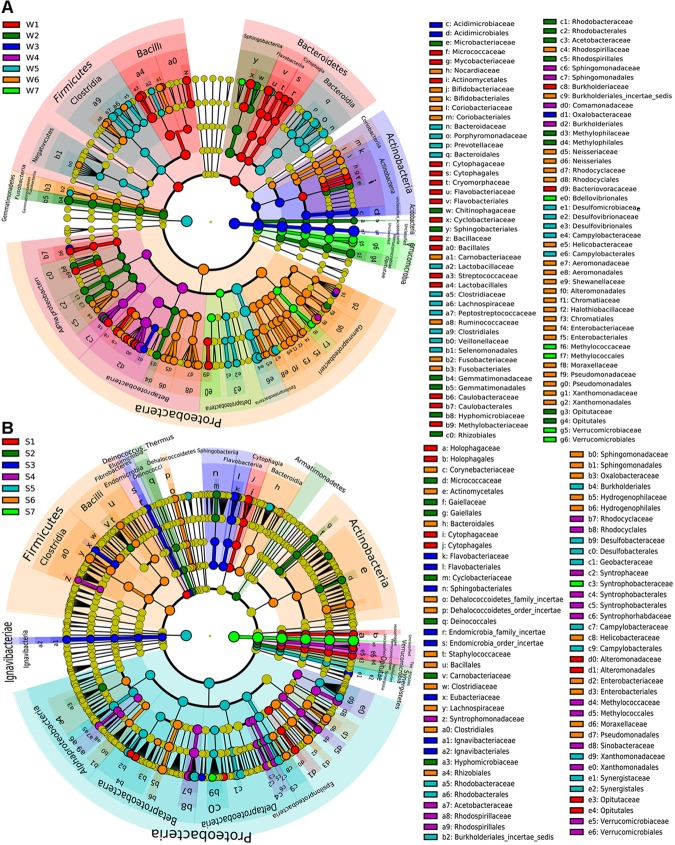
FIGURE 4.
LEfSe analysis of bacteria abundance among different water samples (A) or sediment samples (B). The phylum, class, order, family levels are listed in order from inside to outside of the cladogram and the labels for levels of order and family are abbreviated by a single letter. The red, green, blue, purple, light blue, orange and emerald green circles represent the bacteria enriched in the site 1, 2, 3, 4, 5, 6, and 7, respectively, whereas the yellow circles represent the taxa with no significant differences between 7 sites of the water (A) or sediment (B).

