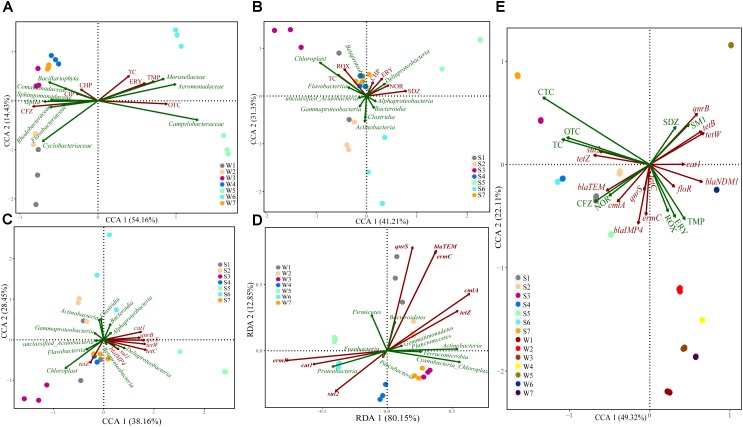
FIGURE 6.
Canonical correspondence or Redundancy analysis of the relationship between bacterial communities and antibiotics/ARGs distribution (A–D), and the correlations among antibiotics abundance and ARGs distribution (E). Samples are performed at different sites for three times in different color solid circles separately.

