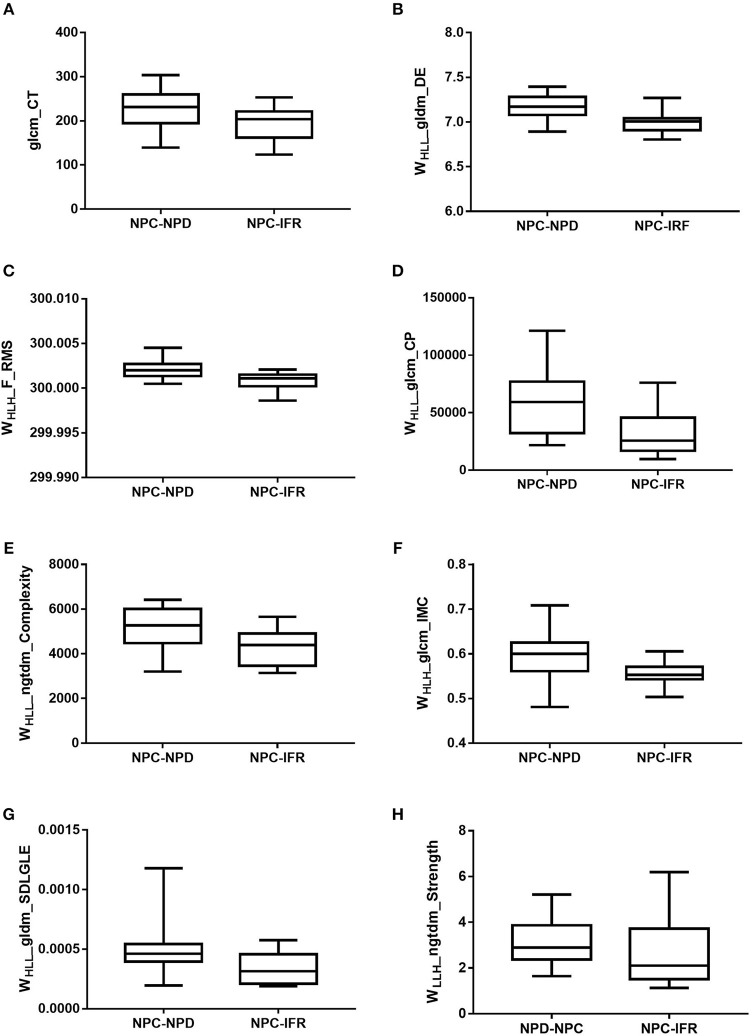
Figure 4.
Box plots of amplitude features, successfully differentiating NPC-IFR from NPC-NPD. (A) glcm_CT (P = 0.046); (B) WHLL_gldm_DE (P = 0.023); (C) WHLH_F_RMS (P = 0.023); (D) WHLL_glcm_CP (P = 0.032); (E) WHLL_ngtdm_Complexity (P = 0.041); (F) WHLH_glcm_IMC (P = 0.041); (G) WHLL_gldm_SDLGLE (P = 0.048); (H) WLLH_ngtdm_Strength (P = 0.048).

