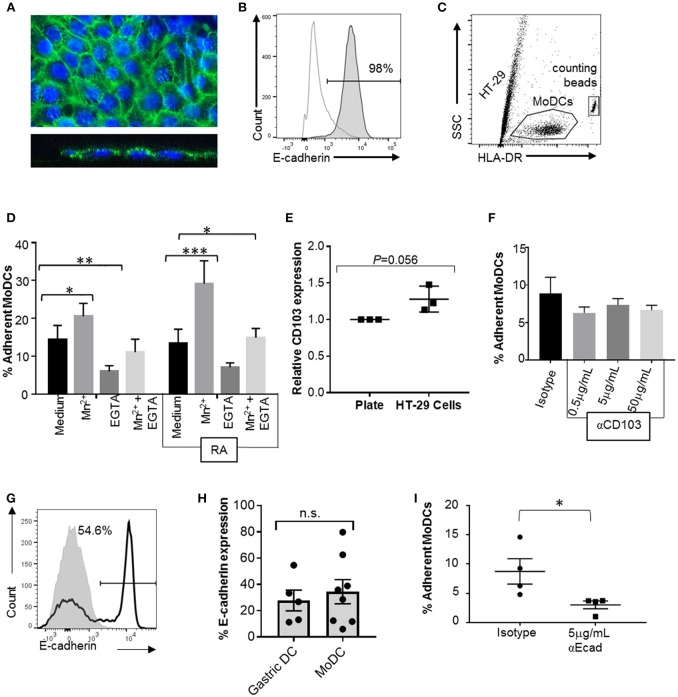
Figure 7.
CD103 is not a major mediator of DC adhesion to E-cadherin-expressing epithelial cells. To analyze MoDC binding to E-cadherin expressed by epithelial cells, MoDCs were added to confluent monolayers of HT-29 cells for 2 h. Non-adherent cells were then removed by gentle washing, the remaining cells were collected by trypsinization, and the number of adherent DCs was determined using counting beads and HLA-DR-labeling of the DCs. (A) Confocal analysis of an HT-29 monolayer shows E-cadherin expression on the luminal surface. Top panel: maximum Z-projection; bottom panel: orthogonal view. Nuclei are labeled with DRAQ5 (blue). (B) Representative FACS histogram of E-cadherin expression on HT-29 cells. Gray line: isotype control; dark gray filled: anti-E-cadherin. (C) Gating strategy for counting adherent MoDCs following co-culture with HT-29 cells. (D) Percentage of MoDCs adherent to HT-29 cells in the presence of Mn2+, EGTA, or Mn2+ + EGTA (n = 6). RA indicates that cells were derived in the presence of 100 nM RA. *P ≤ 0.05, **P ≤ 0.01, ***P ≤ 0.001; 2-way ANOVA with Dunnett's multiple comparisons. (E) Normalized CD103 expression on MoDCs after recovery from HT-29 co-cultures (with Mn2+). Data from three independent experiments, paired, one-tailed Student's t-test. (F) MoDCs were incubated with an isotype control antibody or the indicated concentrations of anti-CD103 antibody before and during co-culture with HT-29 cells, and the number of adherent DCs was determined. N = 3, *P ≤ 0.05; unpaired, two-tailed T-test. (G,H) representative histogram and pooled data for E-cadherin expression on human gastric (n = 5) and MoDCs (n = 8). (I) MoDCs were treated with anti-E-cadherin antibody before and during co-culture with HT-29 cells, and the number of adherent DCs was determined. N = 4, *P ≤ 0.05; unpaired, two-tailed Student's t-test.

