
Figure 4.
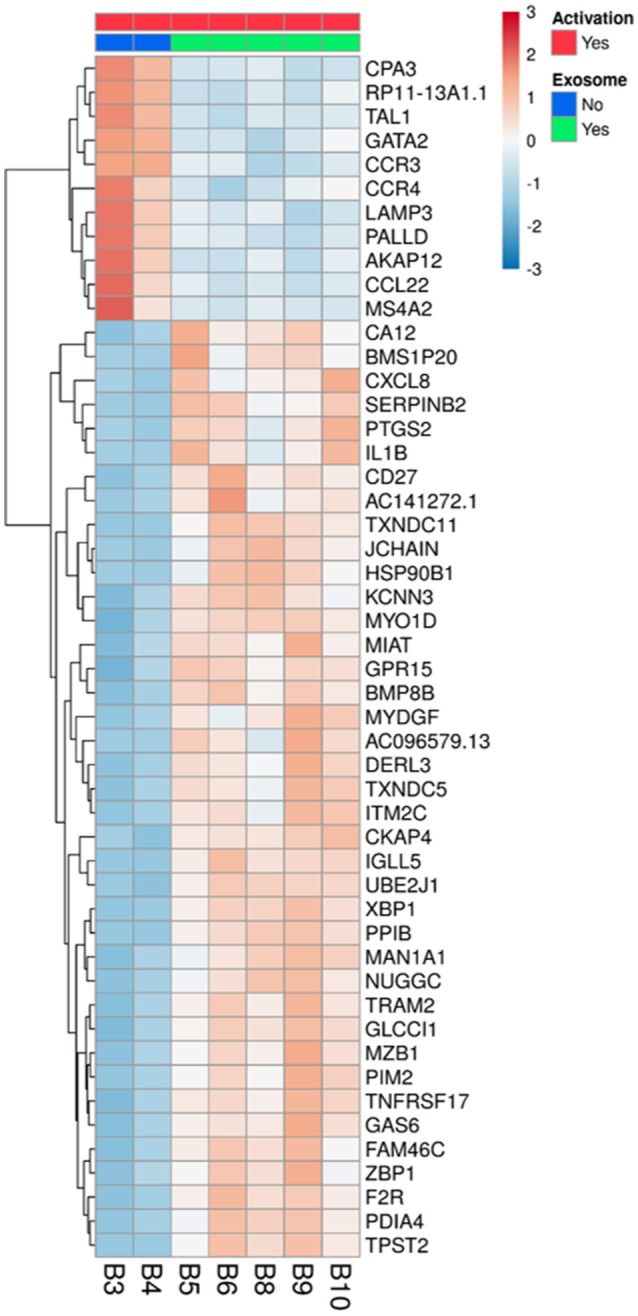
Differentially expressed genes in activated B-lymphocytes, with or without incubation with exosomes. All 5 replicates of cells exposed to exosomes (batches no. 6, 7, 8), samples B5, B6, B8, B9, and B10 (green), were compared to the duplicate samples of cells without exosome exposure, B3 and B4 (blue). The normalized expression of significantly expressed genes, padj <0.05, is shown as a heatmap, after scaling the values for each gene. The color scale is indicated on the top right corner (blue, below average; red, above average). Genes are ordered by hierarchical clustering. Only the 50 genes that were most differentially expressed are shown, with their official symbols.