
Figure 5.
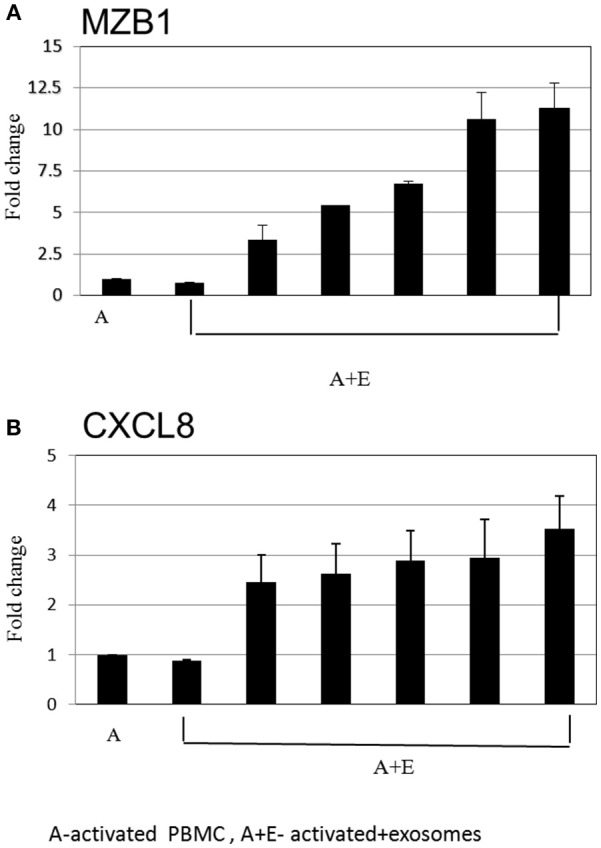
Real time PCR analysis. Expression levels of mRNA depicted for (A) MZB1 (B) CXCL8, were measured in activated B cells with or without exosomes. The graphs show the results of 6 exosome batches (MZB1 exosome batches 6, 8, 10, 12, 9, 3, respectively; CXCL8 exosome batches 6, 9, 10, 8, 12, 3, respectively). GAPDH was used as internal controls for targeting mRNA expression, and data are expressed as the mean of triplicate samples ± S.E.