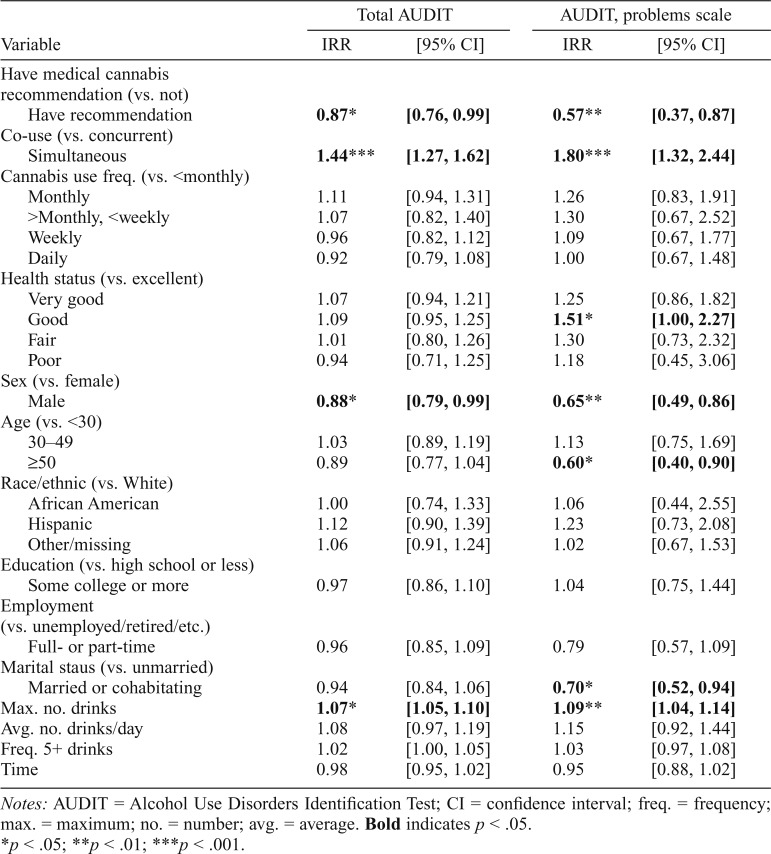
Table 3.
Adjusted incidence rate ratios (IRRs) between medical cannabis use and alcohol-related problems (n = 991)
| Total AUDIT |
AUDIT, problems scale |
|||
| Variable | IRR | [95% CI] | IRR | [95% CI] |
| Have medical cannabis recommendation (vs. not) | ||||
| Have recommendation | 0.87* | [0.76, 0.99] | 0.57** | [0.37, 0.87] |
| Co-use (vs. concurrent) | ||||
| Simultaneous | 1.44*** | [1.27, 1.62] | 1.80*** | [1.32, 2.44] |
| Cannabis use freq. (vs. <monthly) | ||||
| Monthly | 1.11 | [0.94, 1.31] | 1.26 | [0.83, 1.91] |
| >Monthly, <weekly | 1.07 | [0.82, 1.40] | 1.30 | [0.67, 2.52] |
| Weekly | 0.96 | [0.82, 1.12] | 1.09 | [0.67, 1.77] |
| Daily | 0.92 | [0.79, 1.08] | 1.00 | [0.67, 1.48] |
| Health status (vs. excellent) | ||||
| Very good | 1.07 | [0.94, 1.21] | 1.25 | [0.86, 1.82] |
| Good | 1.09 | [0.95, 1.25] | 1.51* | [1.00, 2.27] |
| Fair | 1.01 | [0.80, 1.26] | 1.30 | [0.73, 2.32] |
| Poor | 0.94 | [0.71, 1.25] | 1.18 | [0.45, 3.06] |
| Sex (vs. female) | ||||
| Male | 0.88* | [0.79, 0.99] | 0.65** | [0.49, 0.86] |
| Age (vs. <30) | ||||
| 30–49 | 1.03 | [0.89, 1.19] | 1.13 | [0.75, 1.69] |
| ≥50 | 0.89 | [0.77, 1.04] | 0.60* | [0.40, 0.90] |
| Race/ethnic (vs. White) | ||||
| African American | 1.00 | [0.74, 1.33] | 1.06 | [0.44, 2.55] |
| Hispanic | 1.12 | [0.90, 1.39] | 1.23 | [0.73, 2.08] |
| Other/missing | 1.06 | [0.91, 1.24] | 1.02 | [0.67, 1.53] |
| Education (vs. high school or less) | ||||
| Some college or more | 0.97 | [0.86, 1.10] | 1.04 | [0.75, 1.44] |
| Employment (vs. unemployed/retired/etc.) | ||||
| Full- or part-time | 0.96 | [0.85, 1.09] | 0.79 | [0.57, 1.09] |
| Marital staus (vs. unmarried) | ||||
| Married or cohabitating | 0.94 | [0.84, 1.06] | 0.70* | [0.52, 0.94] |
| Max. no. drinks | 1.07* | [1.05, 1.10] | 1.09** | [1.04, 1.14] |
| Avg. no. drinks/day | 1.08 | [0.97, 1.19] | 1.15 | [0.92, 1.44] |
| Freq. 5+ drinks | 1.02 | [1.00, 1.05] | 1.03 | [0.97, 1.08] |
| Time | 0.98 | [0.95, 1.02] | 0.95 | [0.88, 1.02] |
Notes: AUDIT = Alcohol Use Disorders Identification Test; CI = confidence interval; freq. = frequency; max. = maximum; no. = number; avg. = average. Bold indicates p < .05.
p < .05;
p < .01;
p < .001.

