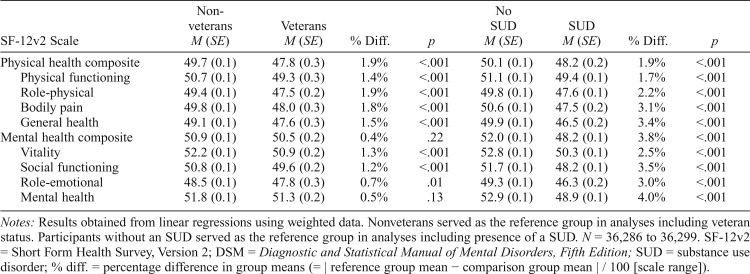
Table 3.
Predicted mean norm-based scores for SF-12v2 composite scales for nonveterans and veterans and participants without any DSM-5 past-year SUD, separately, adjusted for sociodemographic variables
| SF-12v2 Scale | Nonveterans M (SE) | Veterans M (SE) | % Diff. | p | No SUD M (SE) | SUD M (SE) | % Diff. | p |
| Physical health composite | 49.7 (0.1) | 47.8 (0.3) | 1.9% | <.001 | 50.1 (0.1) | 48.2 (0.2) | 1.9% | <.001 |
| Physical functioning | 50.7 (0.1) | 49.3 (0.3) | 1.4% | <.001 | 51.1 (0.1) | 49.4 (0.1) | 1.7% | <.001 |
| Role-physical | 49.4 (0.1) | 47.5 (0.2) | 1.9% | <.001 | 49.8 (0.1) | 47.6 (0.1) | 2.2% | <.001 |
| Bodily pain | 49.8 (0.1) | 48.0 (0.3) | 1.8% | <.001 | 50.6 (0.1) | 47.5 (0.2) | 3.1% | <.001 |
| General health | 49.1 (0.1) | 47.6 (0.3) | 1.5% | <.001 | 49.9 (0.1) | 46.5 (0.2) | 3.4% | <.001 |
| Mental health composite | 50.9 (0.1) | 50.5 (0.2) | 0.4% | .22 | 52.0 (0.1) | 48.2 (0.1) | 3.8% | <.001 |
| Vitality | 52.2 (0.1) | 50.9 (0.2) | 1.3% | <.001 | 52.8 (0.1) | 50.3 (0.1) | 2.5% | <.001 |
| Social functioning | 50.8 (0.1) | 49.6 (0.2) | 1.2% | <.001 | 51.7 (0.1) | 48.2 (0.1) | 3.5% | <.001 |
| Role-emotional | 48.5 (0.1) | 47.8 (0.3) | 0.7% | .01 | 49.3 (0.1) | 46.3 (0.2) | 3.0% | <.001 |
| Mental health | 51.8 (0.1) | 51.3 (0.2) | 0.5% | .13 | 52.9 (0.1) | 48.9 (0.1) | 4.0% | <.001 |
Notes: Results obtained from linear regressions using weighted data. Nonveterans served as the reference group in analyses including veteran status. Participants without an SUD served as the reference group in analyses including presence of a SUD. N = 36,286 to 36,299. SF-12v2 = Short Form Health Survey, Version 2; DSM = Diagnostic and Statistical Manual of Mental Disorders, Fifth Edition; SUD = substance use disorder; % diff. = percentage difference in group means (= | reference group mean − comparison group mean | / 100 [scale range]).

