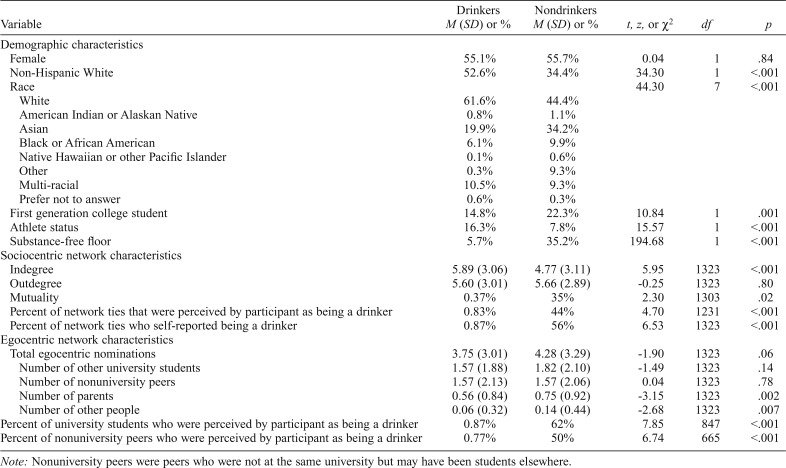
Table 1.
Demographic, sociocentric, and egocentric network differences between drinkers and nondrinkers
| Variable | Drinkers M (SD) or % | Nondrinkers M (SD) or % | t, z, or χ2 | df | p |
| Demographic characteristics | |||||
| Female | 55.1% | 55.7% | 0.04 | 1 | .84 |
| Non-Hispanic White | 52.6% | 34.4% | 34.30 | 1 | <.001 |
| Race | 44.30 | 7 | <.001 | ||
| White | 61.6% | 44.4% | |||
| American Indian or Alaskan Native | 0.8% | 1.1% | |||
| Asian | 19.9% | 34.2% | |||
| Black or African American | 6.1% | 9.9% | |||
| Native Hawaiian or other Pacific Islander | 0.1% | 0.6% | |||
| Other | 0.3% | 9.3% | |||
| Multi-racial | 10.5% | 9.3% | |||
| Prefer not to answer | 0.6% | 0.3% | |||
| First generation college student | 14.8% | 22.3% | 10.84 | 1 | .001 |
| Athlete status | 16.3% | 7.8% | 15.57 | 1 | <.001 |
| Substance-free floor | 5.7% | 35.2% | 194.68 | 1 | <.001 |
| Sociocentric network characteristics | |||||
| Indegree | 5.89 (3.06) | 4.77 (3.11) | 5.95 | 1323 | <.001 |
| Outdegree | 5.60 (3.01) | 5.66 (2.89) | -0.25 | 1323 | .80 |
| Mutuality | 0.37% | 35% | 2.30 | 1303 | .02 |
| Percent of network ties that were perceived by participant as being a drinker | 0.83% | 44% | 4.70 | 1231 | <.001 |
| Percent of network ties who self-reported being a drinker | 0.87% | 56% | 6.53 | 1323 | <.001 |
| Egocentric network characteristics | |||||
| Total egocentric nominations | 3.75 (3.01) | 4.28 (3.29) | -1.90 | 1323 | .06 |
| Number of other university students | 1.57 (1.88) | 1.82 (2.10) | -1.49 | 1323 | .14 |
| Number of nonuniversity peers | 1.57 (2.13) | 1.57 (2.06) | 0.04 | 1323 | .78 |
| Number of parents | 0.56 (0.84) | 0.75 (0.92) | -3.15 | 1323 | .002 |
| Number of other people | 0.06 (0.32) | 0.14 (0.44) | -2.68 | 1323 | .007 |
| Percent of university students who were perceived by participant as being a drinker | 0.87% | 62% | 7.85 | 847 | <.001 |
| Percent of nonuniversity peers who were perceived by participant as being a drinker | 0.77% | 50% | 6.74 | 665 | <.001 |
Note: Nonuniversity peers were peers who were not at the same university but may have been students elsewhere.

