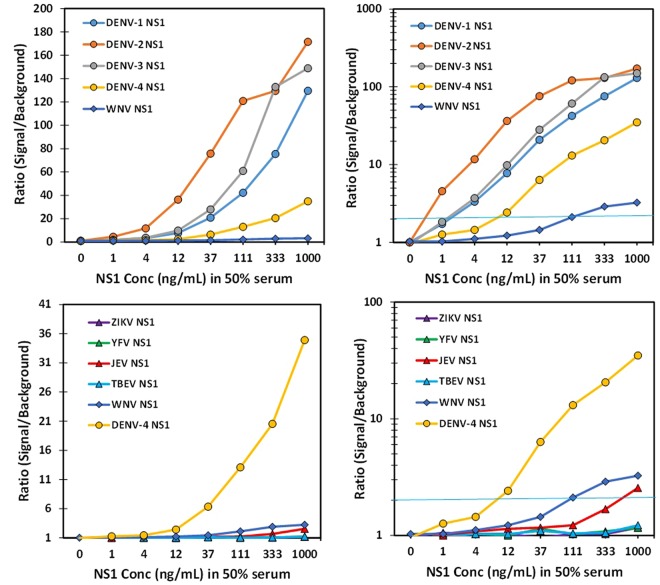
Figure 5.
MagPlex detection of DENV NS1 versus NS1 from other flaviviruses. Dilutions of NS1 were prepared in 50% serum and evaluated using the amplified MagPlex assay with DD7-GS3K as the capture and Bt-DD5-GS3K as the tracer sdAb. The top panels (linear plot left and log plot right) show detection of NS1 from all four DENV serotypes versus NS1 from WNV. While the bottom panels (linear plot left and log plot right) show the comparison of signal produced by NS1 from other flaviviruses versus the signal produced by DENV-4 NS1. The blue line in the right panels represents a signal to background ratio of 2; a value greater or equal to 2 was defined as a positive.

