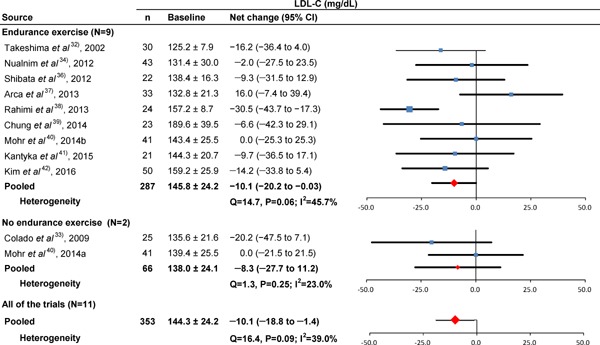
Fig. 3.

Baseline LDL-C and forest plot for the net changes in LDL-C. Each trial is represented with black squares (net change) and widths (95% CI); the size of the black squares is in proportion to the weighting by inverse variance in each trial. The pooled net changes are represented by black rhombuses (net change) and widths (95% CI).
