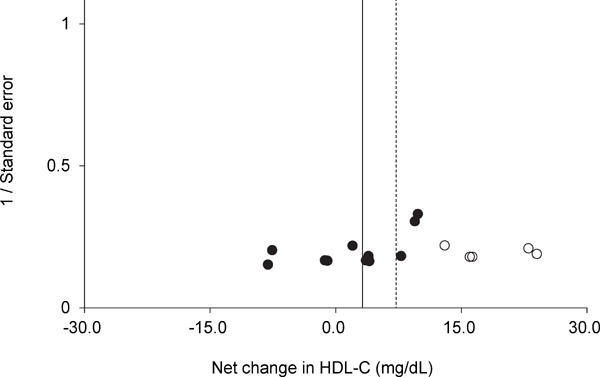
Supplementary Fig. 1.

Funnel plot of HDL-C for each trial. Egger's regression test indicated that the funnel plot had significant asymmetry. A vertical line indicates the pooled net change in HDL-C (3.1 mg/dL). The trim and fill method of Duval and Tweedie suggested that there were five missing trials (white circles). A dotted vertical line indicates the pooled net change in HDL-C after adjusting for the missing trials (7.4 mg/dL).
