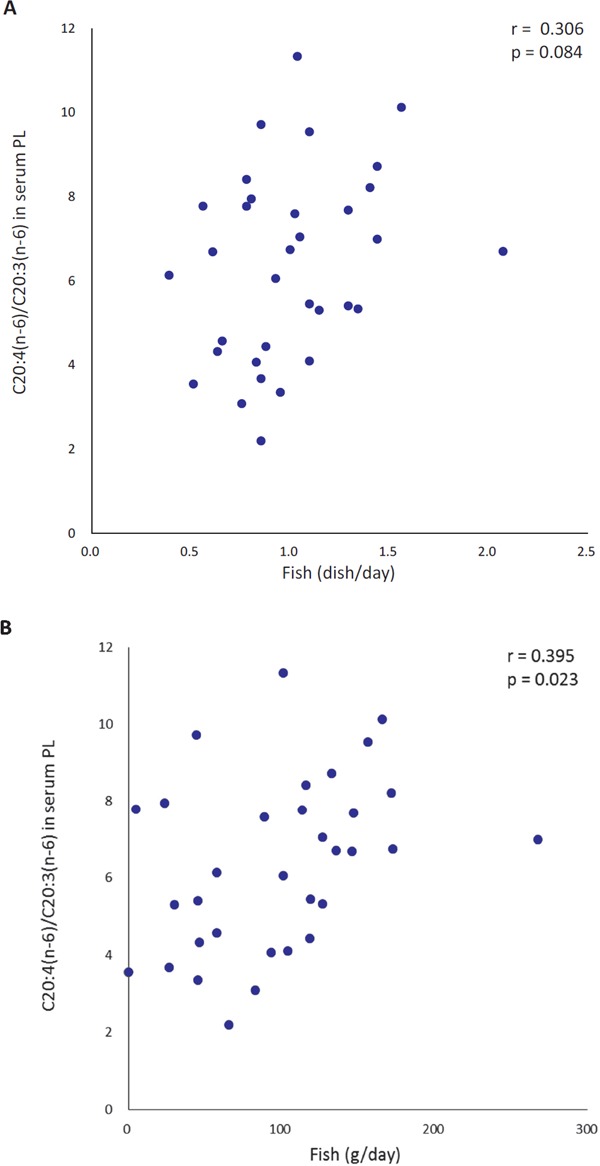
Fig. 2.

Simple correlations between fish dish intake (A) and fish intake (B) during the 6 week intervention and C20:4(n-6)/C20:3 (n-6) fatty acid ratios in serum phospholipids (PL) at the end of the 6 week intervention
n = 33, PL: phospholipid, PUFA: polyunsaturated fatty acid
