
Figure 2.
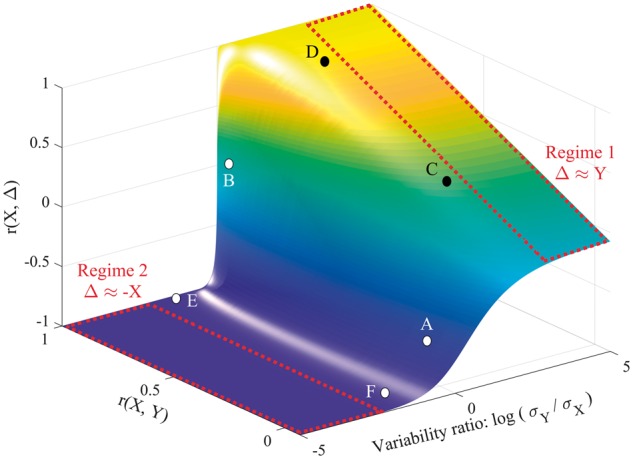
The relationship between r(X,Y), r(X,Δ) and σY/σX. Note that the x-axis is log-transformed to ensure symmetry around 1; when X and Y are equally variable, log(σY/σX) = 0. Supplementary material, proposition 7 in Appendix A, provides a justification for unambiguously using a ratio of standard deviations in this figure, rather than σY and σX as separate axes. The two major regimes of Equation 1 are also marked in red. In Regime 1, Y is more variable than X, so contributes more variance to Δ, and r(X,Δ) ≈ r(X,Y). In Regime 2, X is more variable than Y, so X contributes more variance to Δ, and r(X,Δ) ≈ r(X,−X) (i.e. −1). The transition between the two regimes, when the variability ratio is not dramatically skewed either way, also allows for spurious r(X,Δ). For the purposes of illustration, the figure also highlights six points of interest on the surface, marked A–F; examples of simulated recovery data corresponding to these points are provided in Fig. 3.