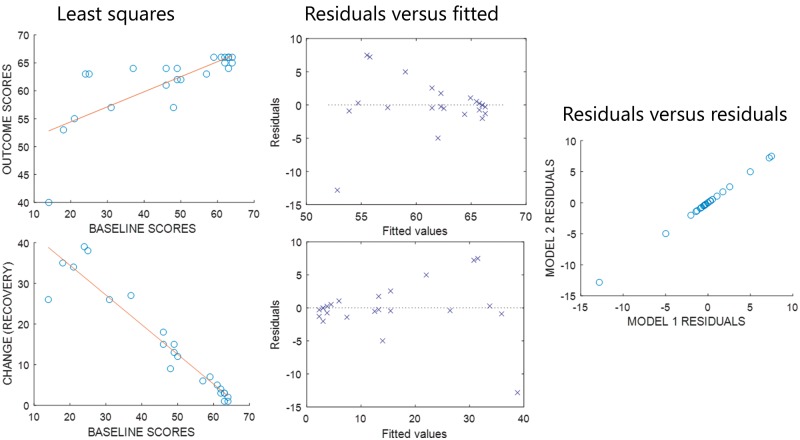
Figure 4.
r(X,Y) and r(X,Δ) have the same residuals. Left: Least squares linear fits for analyses relating baselines to (top) outcomes and (bottom) recovery, using the fitters’ data reported by Zarahn et al. (2011). Middle: Plots of residuals relative to each least squares line, against the fitted values in each case. Right: A scatter plot of the residuals from the model relating baselines to change, against the residuals from the model relating baselines to outcomes: the two sets of residuals are the same.

