Figure 1.
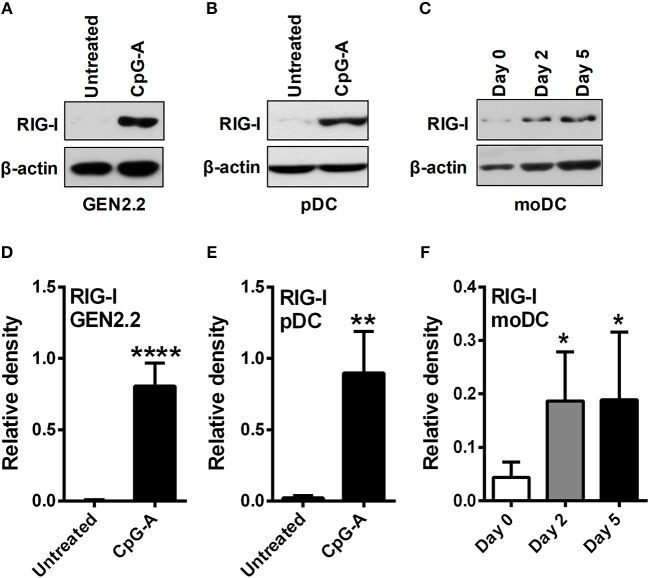
Plasmacytoid DCs display distinct RIG-I expression profile compared to moDCs. GEN2.2 cells (A,D) and primary human pDCs (B,E) were treated with TLR9 agonist CpG-A (0.25 μM) for 16 h then the protein level of RIG-I was determined by western blotting. (C,F) Freshly isolated monocytes were seeded in 24-well plates and differentiated as described in the Materials and Methods. The protein level of RIG-I was measured by western blotting. Representative blots are shown in (A–C). Data are shown as mean ± SD of at least three independent measurements in (D–F). *p < 0.05, **p < 0.01, ****p < 0.0001.

