Figure 2.
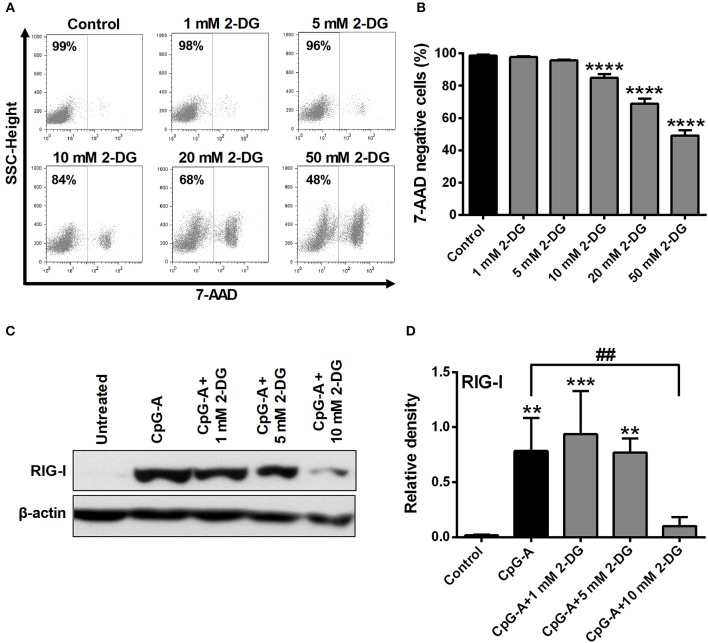
Inhibition of glycolysis influences the viability and RIG-I expression of GEN2.2 cells in a concentration-dependent manner. (A,B) GEN2.2 cells were treated with increasing concentration of 2-deoxy-D-glucose (2-DG; 1–50 mM) then cell viability was analyzed by flow cytometry. (C,D) GEN2.2 cells were left untreated, treated with TLR9 ligand CpG-A (0.25 μM) alone or in combination with increasing concentrations of 2-DG (1–10 mM) for 16 h then the protein level of RIG-I was measured by western blot. (A) Representative dot plots are shown, where numbers indicate the percentage of 7-aminoactinomycin D (7-AAD) negative cells. (B) Bar graphs show the mean ± SD of four independent experiments. (C) Representative blot is shown. (D) Bar graphs represent the mean ± SD of four individual experiments. **p < 0.01, ***p < 0.001 ****p < 0.0001 vs. control; ##p < 0.01.

