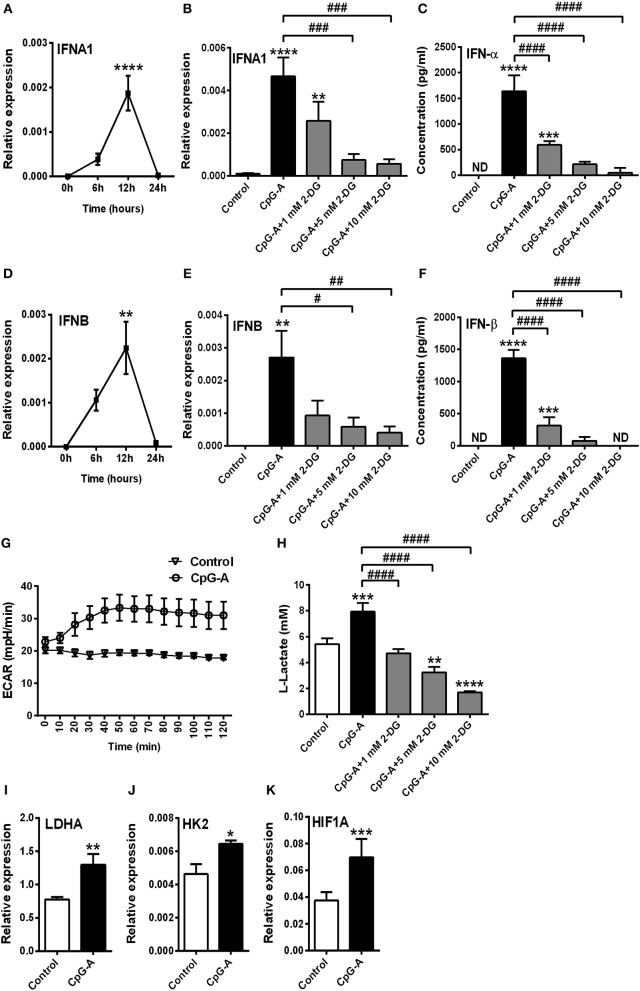
Figure 3.
A shift to glycolysis is essential to the CpG-A-induced production of type I IFNs in GEN2.2 cells. (A,D) GEN2.2 cells were treated with 1 μM of CpG-A, and the expression of IFNA1 and IFNB was measured in a time-dependent manner at the mRNA level by Q-PCR. (B,C,E,F) GEN2.2 cells were left untreated, treated with 1 μM of CpG-A alone or in combination with increasing concentrations of 2-deoxy-D-glucose (2-DG; 1–10 mM) for 12 h. The IFN-α and IFN-β expression was assessed by real-time PCR at the mRNA level (B,E) and by ELISA at the protein level (C,F). (G) Following activation with CpG-A real-time ECAR of GEN2.2 cells was determined by EFA. The results of a representative experiment are shown. (H) Lactate concentrations were measured from the supernatants at 12 h. The expression of LDHA (I), HK2 (J), and HIF1A (K) was assessed at the mRNA level by real-time PCR. Figures represent the mean ± SD of 4–6 independent experiments. *p < 0.05, **p < 0.01, ***p < 0.001 ****p < 0.0001 vs. control; #p < 0.05, ##p < 0.01, ###p < 0.001, ####p < 0.0001, ND, not determined.

