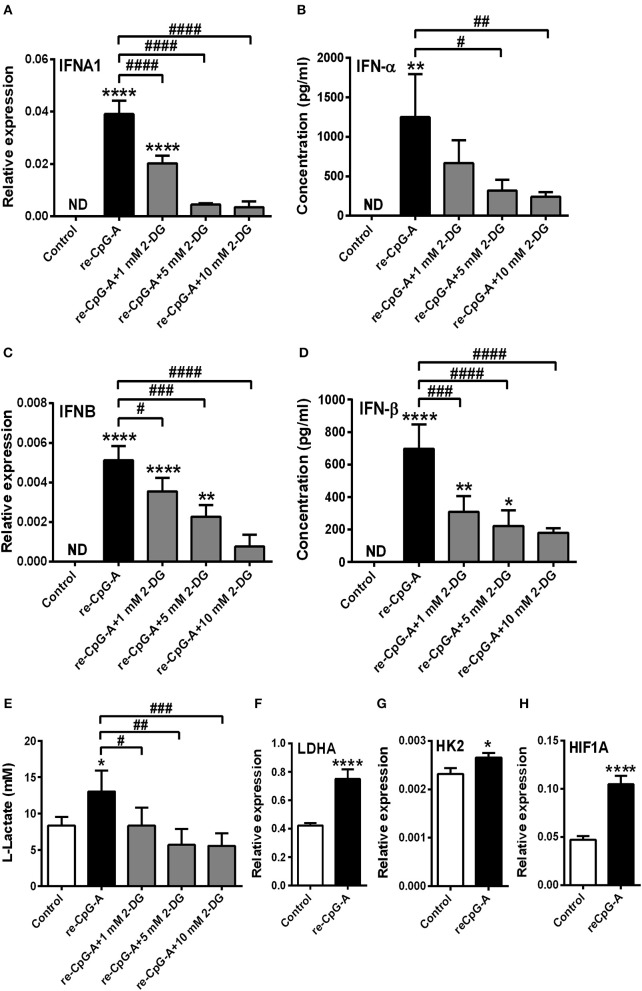
Figure 5.
The type I IFN production of GEN2.2 cells induced by a second exposure to CpG-A also depends on glycolytic metabolism. GEN2.2 cells were pre-treated with 0.25 μM of CpG-A for 16 h then following thorough washing steps re-stimulated with 1 μM CpG-A (re-CpG-A) in the absence or presence of 2-deoxy-D-glucose (2-DG; 1–10 mM). The IFNA1 and IFNB mRNA expression level was assessed by real-time PCR (A,C) and the IFN-α and IFN-β protein level was measured by ELISA (B,D) at 12 h. (E) Lactate concentrations were determined from the supernatants of the cells at 12 h. The expression of LDHA (F), HK2 (G), and HIF1A (H) was assessed at the mRNA level by real-time PCR. (A–H) Bar graphs represent the mean ± SD of four independent experiments. *p < 0.05, **p < 0.01, ****p < 0.0001 vs. control; #p < 0.05, ##p < 0.01, ###p < 0.001, ####p < 0.0001, ND, not determined.

