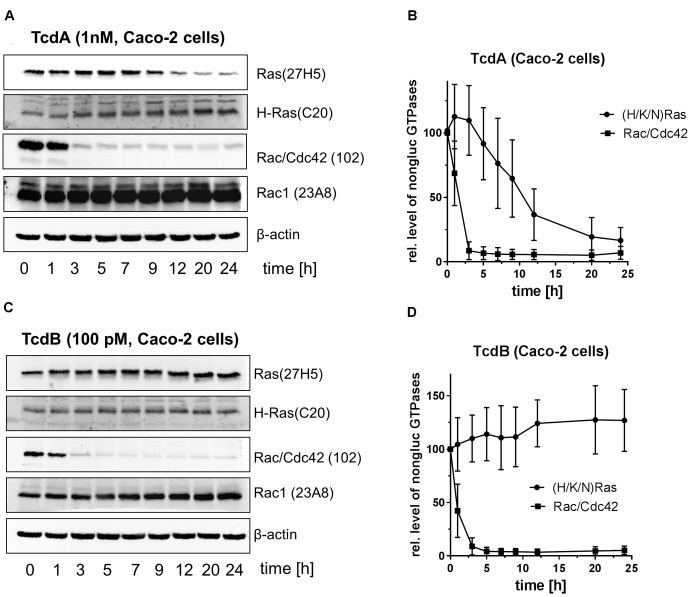
FIGURE 2.
Immunoblot-based analysis of the glucosylation of (H/K/N)Ras and Rac/Cdc42 in TcdA- and TcdB-treated Caco-2 cells. Caco-2 cells were exposed to natively prepared TcdA-10463 (A,B) or TcdB-10463 (C,D) for the indicated times. Upon cell lysis, the cellular concentrations of glucosylated (H/K/N)Ras and Rac/Cdc42 subtype GTPases were evaluated using immunoblot analysis. Immunoblots were quantified using Kodak software. The amounts of non-glucosylated Rac/Cdc42 and non-glucosylated (H/K/N)Ras relative to the respective total levels of Rac1 and H-Ras are expressed as mean ± SD of three experiments.

