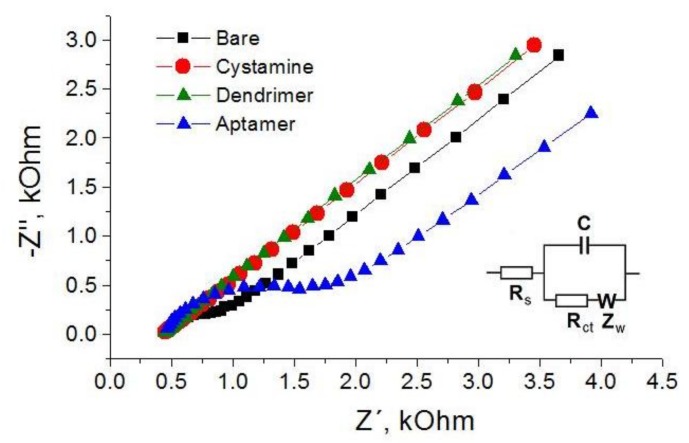
Figure 2.
Nyquist plots corresponding to the main steps of aptasensor preparation from bare gold surface to cystamine layer, dendrimer adlayer and finally after immobilization of aptamers (see the legend). Inset represent Randles equivalent circuit that models electrical properties of the layers. Rs and Rct are the electrolyte and charge transfer resistances, respectively. Zw is the Warburg impedance resulting from the diffusion of the redox probe and C is the capacitance of the electrode surface/solution interface. Experiments were performed in the working phosphate buffer containing 5 mM (1:1) [Fe(CN)6]3−/4− as a redox probe.

