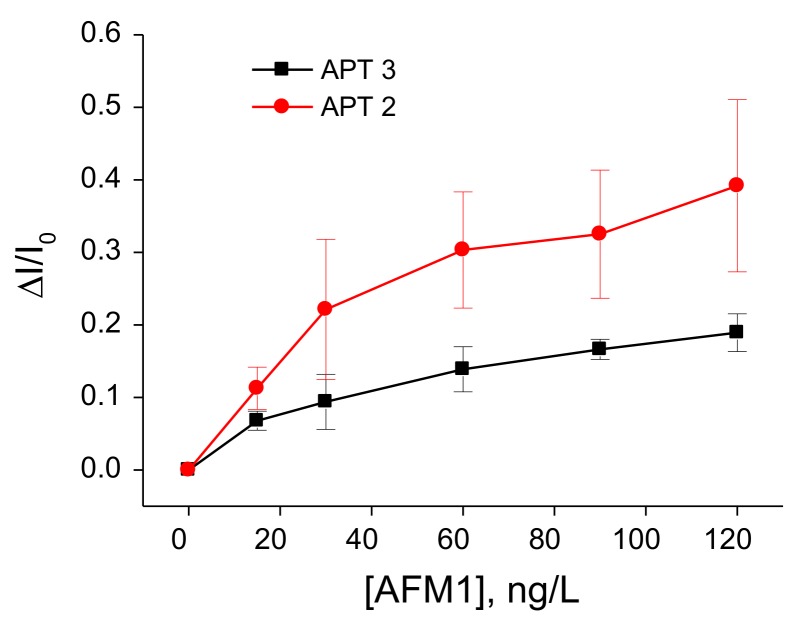
Figure 5.
Plot of the relative changes of peak current ΔI/I0 vs. concentration of AFM1 constructed based on the DPV presented on Figure 4. (ΔI/I0 = (I − I0)/I0, where I is the peak current at certain concentration of AFM1 and I0 those without AFM1). Results represent mean ± SD obtained from 3 independent experiments in each series.

