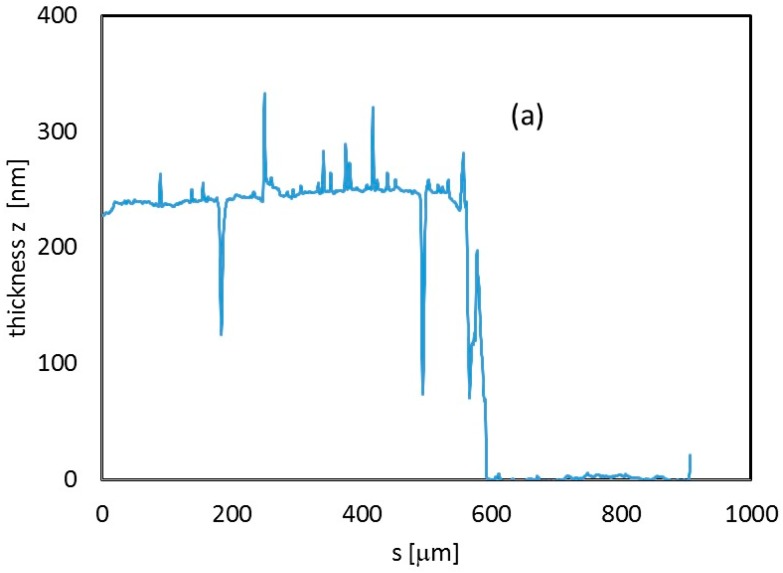
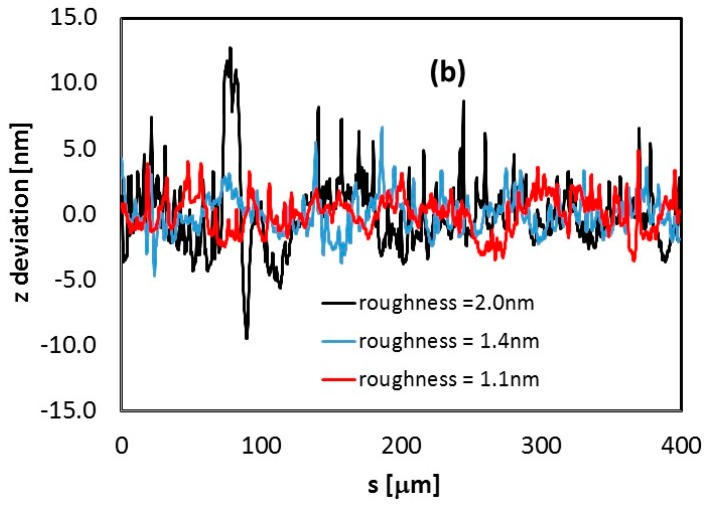
Figure 4.
(a) Thickness profile (z direction) measured along a 900 μm path from the center of the In2O3 sample deposited on glass. (b) Thickness deviation from flat-film condition, estimated along three different profiles, 400 μm-long, within the same In2O3 230 nm-thick film deposited on a glass substrate. For each of them, roughness is calculated as the average value of absolute deviation data.


