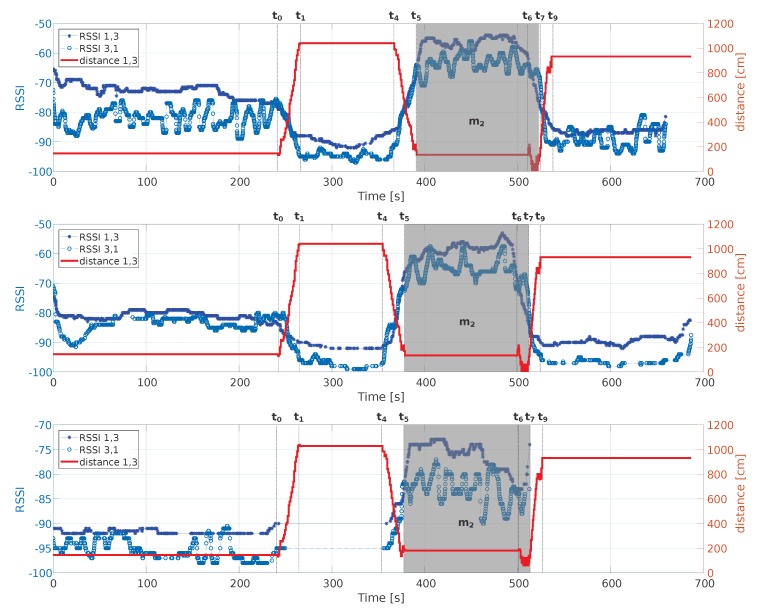
Figure 7.
Symmetry analysis between Mobile 1 and Mobile 3 in accordance with the relative distance. Relevant timestamps related to the movements of Actors 1 and 3 in the scenario “Social 4” are shown, together with the social interaction period Meeting m2 as grey area. From the top to bottom, the transmission power values are: 3 dBm (top); −6 dBm (middle); and −18 dBm (bottom).

