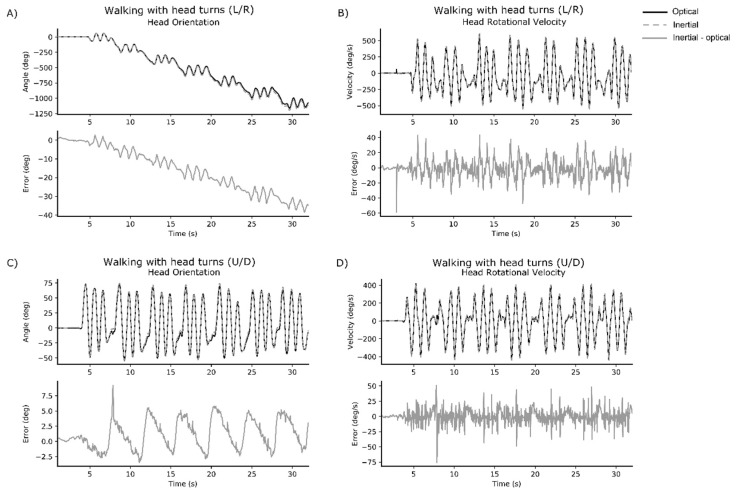
Figure 1.
Representative time series data from one healthy participant. Each subplot provides the optical signal (black solid line) and IMU signal (grey dashed line) overlaid in the upper figure, and the error between optical and IMU signal below (grey solid line). Subplots represent: (A) head orientation for walking with head turns (L/R); (B) peak rotational velocity of the head for walking with head turns (L/R); (C) head orientation for walking with head turns (U/D); and (D) peak rotational velocity of the head for walking with head turns (U/D).

