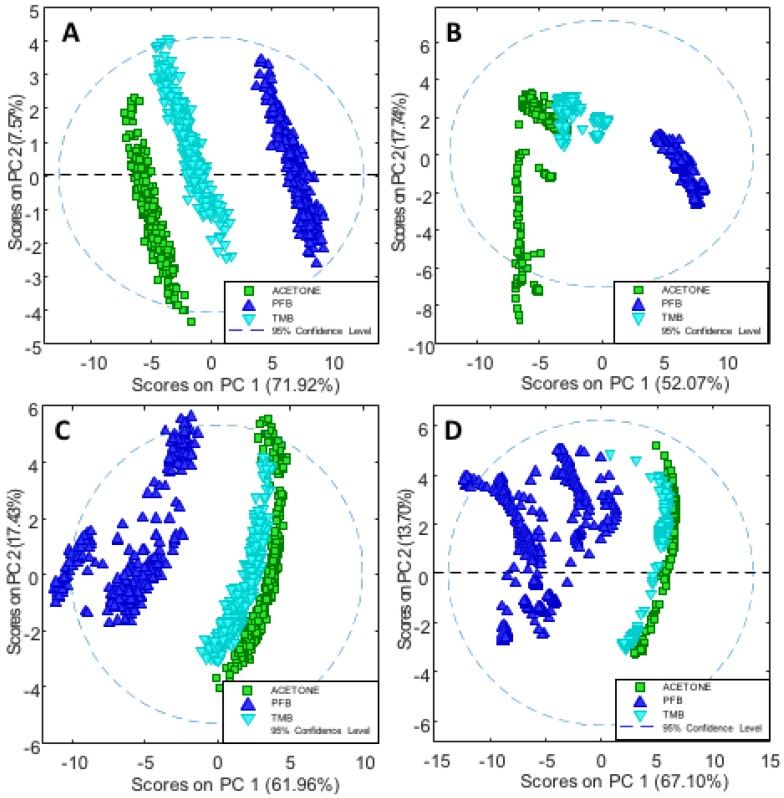
Figure 7.
(A) PC1 versus PC2 scores plot depicting ssDNA treated with the PFB and TMB and the non-treated DNA (control in acetone/water) in the dehydrated state; (B) PC1 versus PC2 scores plot for the rehydrated ssDNA with and without drug treatment; (C) PC1 versus PC2 scores plot for dehydrated dsDNA with and without drug treatment; (D) PC1 versus PC2 Scores Plot for rehydrated dsDNA with and without the drug treatment.

