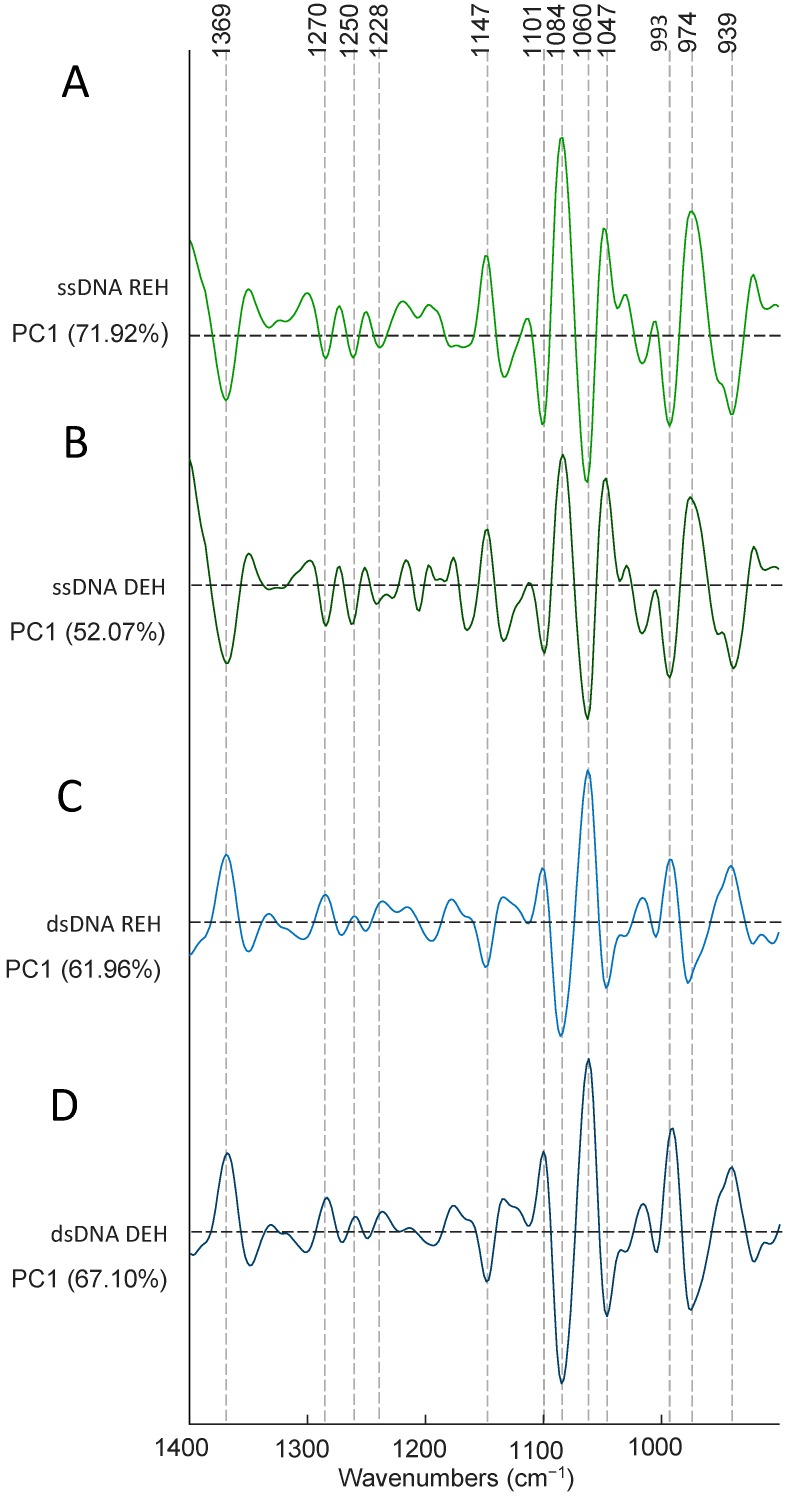
Figure 8.
(A) PC1 loadings plot depicting ssDNA treated with PFB and TMB and the non-treated DNA (control in acetone/water) in the dehydrated state. The positive loadings are associated with the controls and the negative loadings are associated with the drug inoculated cells; (B) PC1 loadings plot for the rehydrated ssDNA with and without drug treatment. The positive loadings are associated with the negative scores. The positive loadings are associated with the controls and the negative loadings are associated with the drug inoculated cells; (C) PC1 loadings plot for dehydrated dsDNA with and without drugs. The positive loadings are associated with the drug inoculated cells and the negative loadings are associated with the control cells; (D) PC1 versus PC2 loadings plot for rehydrated dsDNA with and without the drugs. The positive loadings are associated with the drug inoculated cells and the negative loadings are associated with the control cells.

