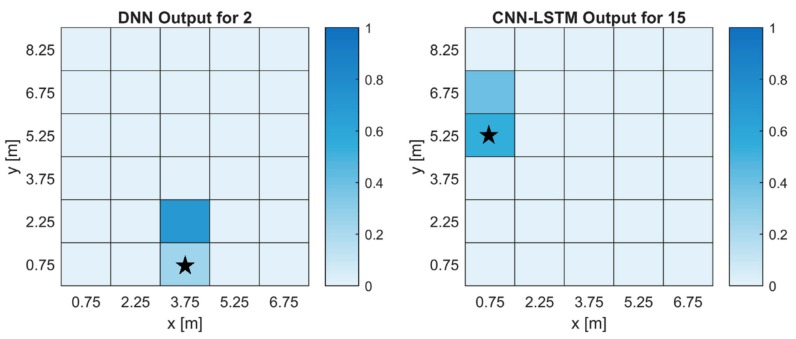
Figure 6.
Heatmaps of the ANN output with the lowest prediction rate for each ANN architecture. The labels are the same as the cell numbers in Figure 2. The true gas source location is indicated by the star. (a) The output of a label with the lowest prediction rate for the DNN. (b) The output of a label with the lowest prediction rate for the CNN-LSTM.

