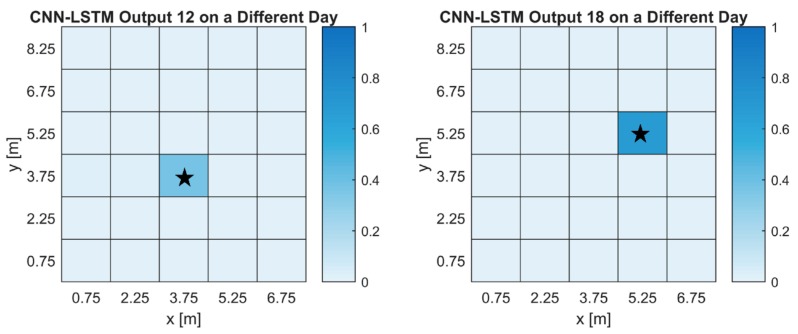
Figure 7.
Heatmaps of the CNN-LSTM output using data collected on a different day. The labels are the same as the cell numbers in Figure 2. The true gas source location is indicated by the star. (a) The output of the CNN-LSTM for a gas source placed in cell 12. (b) The output of the CNN-LSTM for a gas source placed near cell 18.

