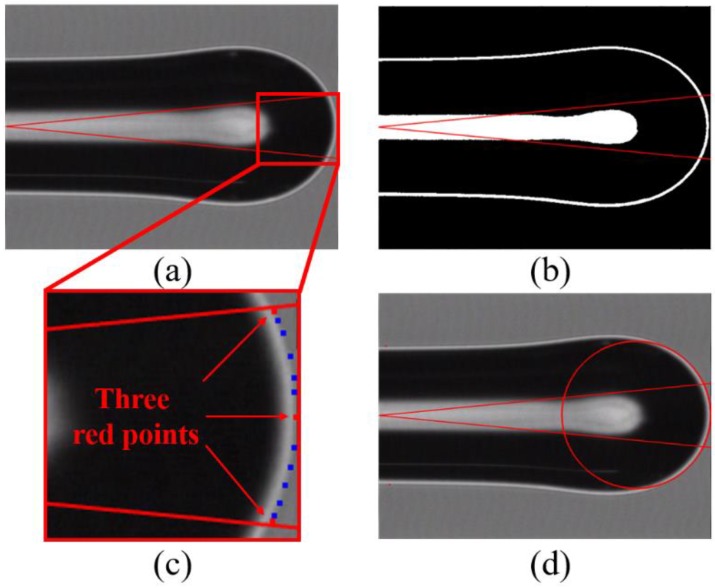
Figure 4.
The radius of curvature measurement for a LOF lens surface. (a) Microscope image of a fabricated LOF, (b) binary image, (c) magnified image, and (d) curve-fitted image. The red lines represent the area where the beam actually propagates. The red dots in (c) were taken from the binary image of (b), and used to get the fitting circle of (d).

