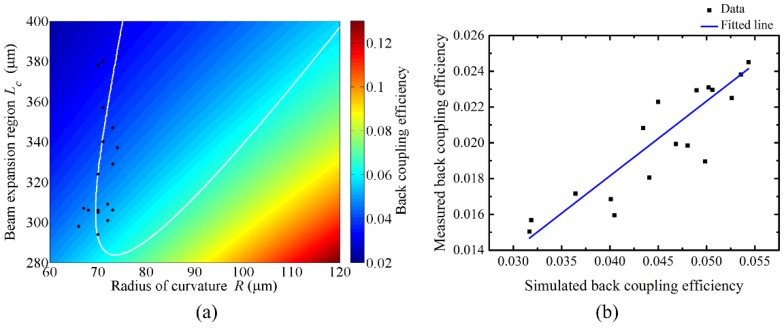
Figure 8.
Back-coupling efficiency of a LOF. (a) Simulated and color-coded in terms of Lc and R. The black dots represent the fabrication parameters measured with 17 fabricated LOFs. The white contour represents the various combinations for having a working distance of 380 μm. (b) Measured and compared with simulated ones. The blue solid line is a fitted line.

