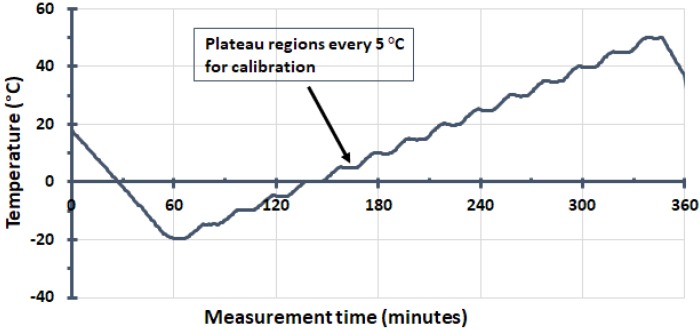
Figure 4.
An example of the temperature profile of the climate chamber, measured by one of the sensors, used to calibrate the ds18b20 sensors. This plot is quite typical for all of the sensors investigated, with measurements recorded every 18 s. The duration of each 5 C horizontal plateau region is approximately 20 min.

