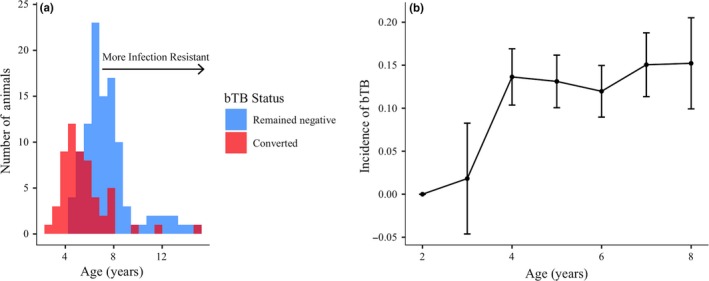
Figure 2.

Bovine tuberculosis infection patterns in African buffalo. (a) Conversion age distribution of animals that converted to bovine tuberculosis (bTB) positive during the study period (red, n = 56) and the final observed age distribution of animals that remained bTB negative throughout the study period (blue, n = 106). The dark red area represents the overlap in the two histograms. Animals that converted later in life or remained bTB negative to a later age are considered more infection resistant than those that converted at a young age. Animals that were bTB positive at first capture are not shown (n = 26). (b) Observed age‐specific incidence of bTB calculated as the number of animals that converted to bTB positive (new cases) over the total number at risk for each age. Incidence of bTB increased to age four, then leveled off and remained relatively constant in this herd of buffalo (n = 202). Error bars represent standard error
