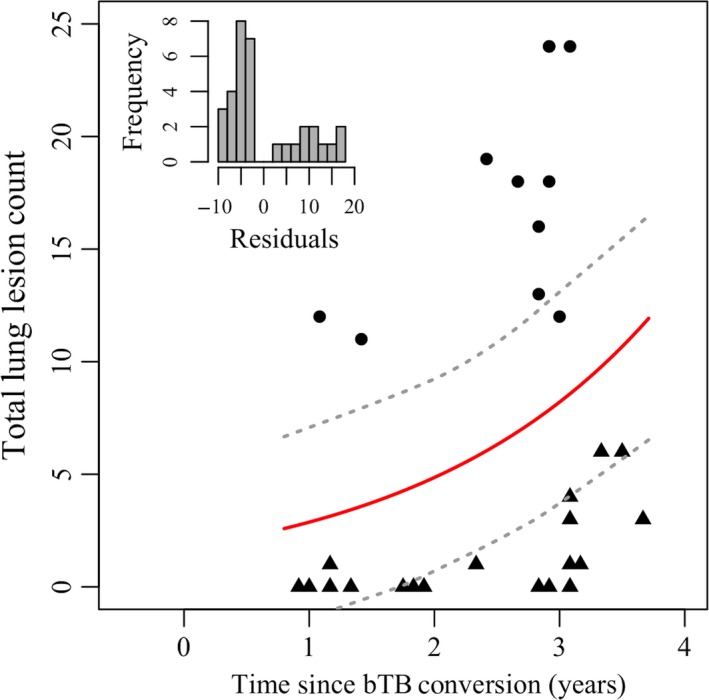
Figure 3.

Lung pathology associated with bovine tuberculosis infection reflects level of proliferation resistance. The graph displays the number of bovine tuberculosis (bTB) lung lesions over time since conversion to bTB positive. Here we see two distinct groups of animals on either side of the nonlinear prediction line (red with gray 95% confidence bands; y = 1.7 × 1.69x). Those observations above the regression line had positive residuals and are considered proliferation susceptible (circles), and had a higher number of lesions than would be expected given time since conversion. Those points below the regression line had negative residuals and are considered proliferation resistant (triangles) and had less pathology than predicted. The inset histogram of residual values displays these two distinct groups
