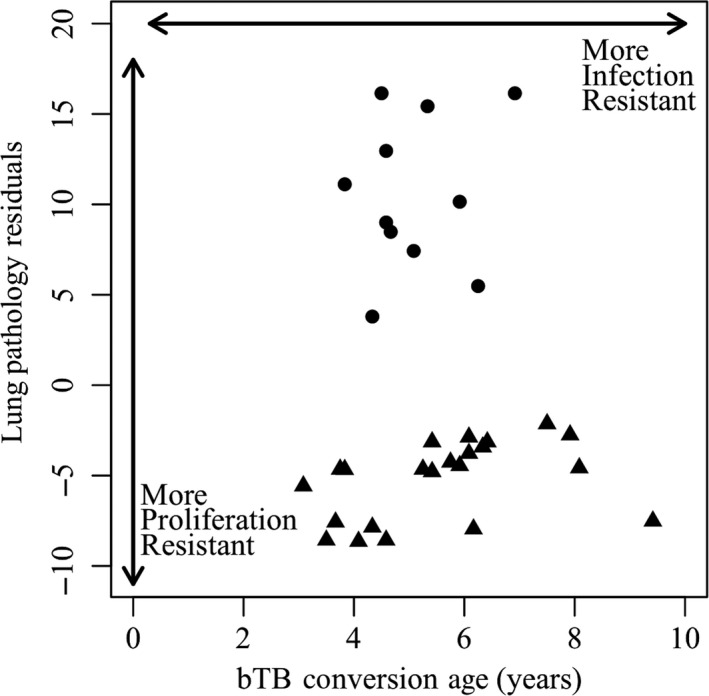
Figure 4.

Individuals within resistance trait space. We observed high variation in both time to onset of infection (infection resistance) and lung lesions accumulated over time (proliferation resistance‐ triangles denote low lesion accumulation). The two resistance phenotypes were not correlated, with some African buffalo displaying high values of one form of resistance, some displaying high values of both forms of resistance, and others displaying neither form. Each converted, culled animal is represented one time along each continuous axis in resistance trait space (n = 33)
