Figure 3.

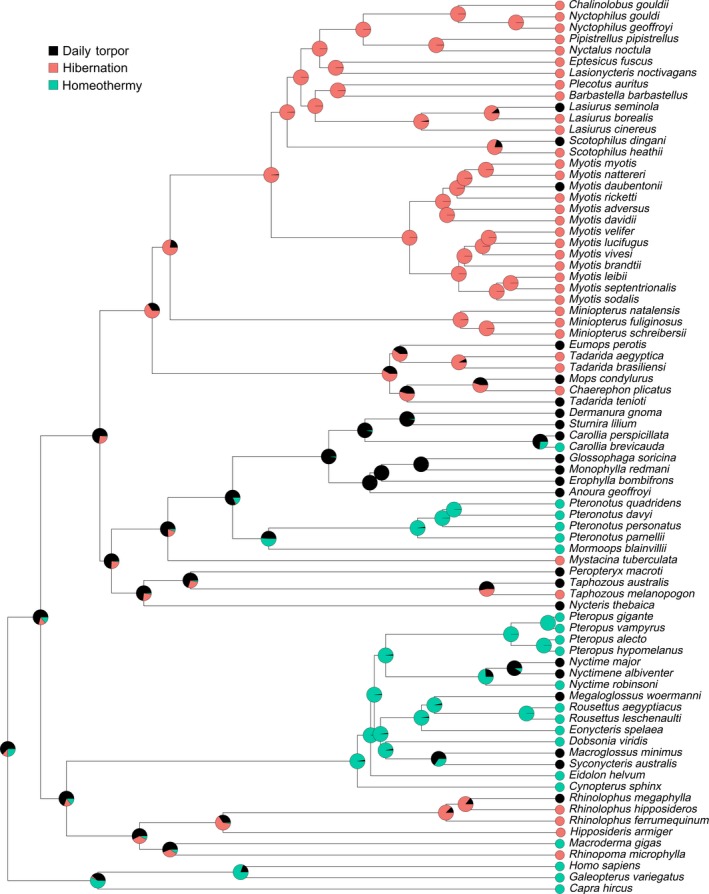
Ancestral state reconstruction from stochastic character mapping. Topology of tree generated from Amador et al. (2016). Pie charts represent the posterior probability of each thermoregulatory regime at a given node

Ancestral state reconstruction from stochastic character mapping. Topology of tree generated from Amador et al. (2016). Pie charts represent the posterior probability of each thermoregulatory regime at a given node