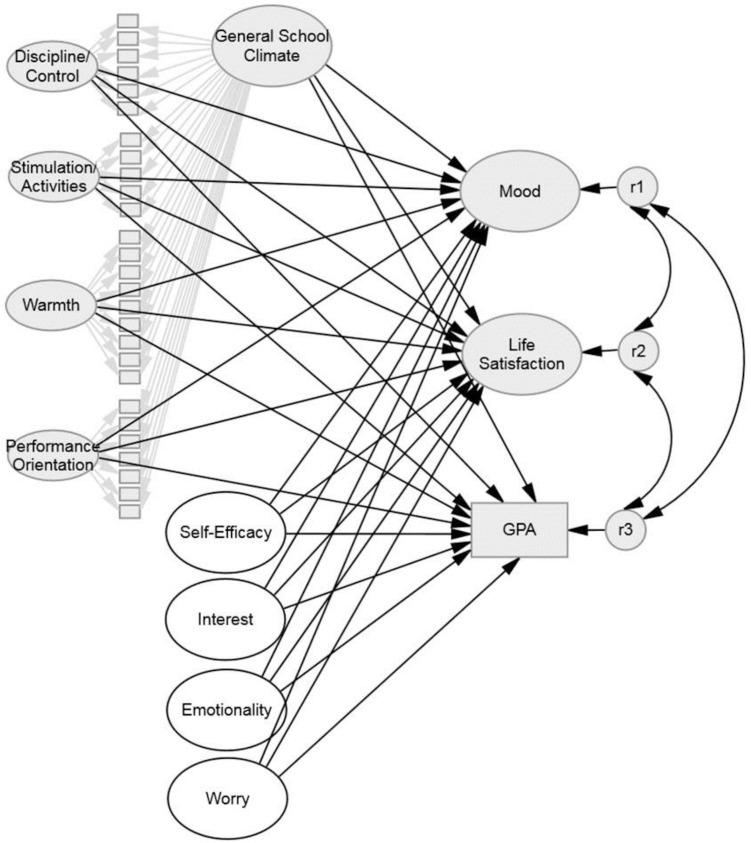
FIGURE 2.
The whole model that was tested. For reasons of clarity, correlations between exogenous factors are not depicted. Results are displayed in Table 3. Constructs displayed with a gray background were tested in Model 1: SWB, Model 2: GPA, and Model 3: SWB + GPA. These results are displayed in Table 2.

