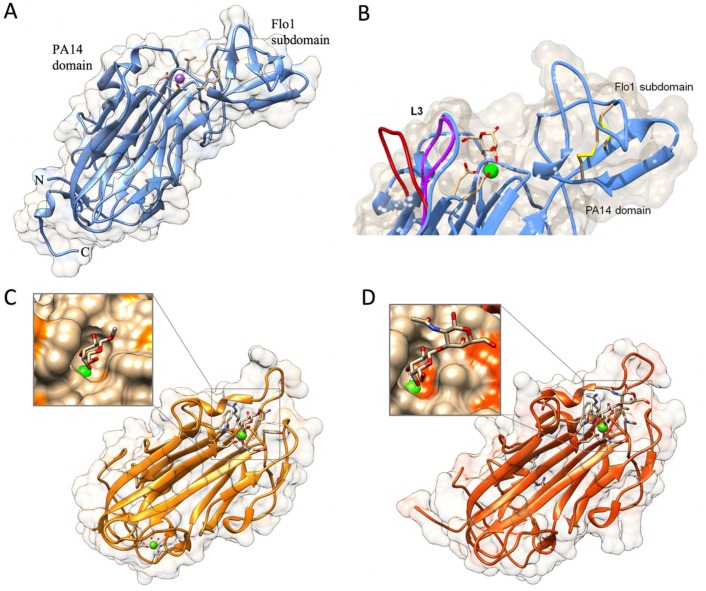
Figure 5.
(A) N-Flo1p (B) Partial view of the N-Flo1p binding pocket (light blue ribbon/surface) in complex with calcium–mannose. Conformations of the L3 loop from N-Lg-Flo1p (purple) and N-Flo5p (crimson; from PDB entry 2XJP) bound states are also shown for comparison. Reprinted from [39]. (C) Overall fold of N-Epa1p with zoomed view of the interaction of galactose to Ca2+ in the binding pocket (PDB entry 4A3X). (D) N-Epa6p with zoomed view of the binding of the T-antigen in the binding pocket (PDB entry 4COW).

