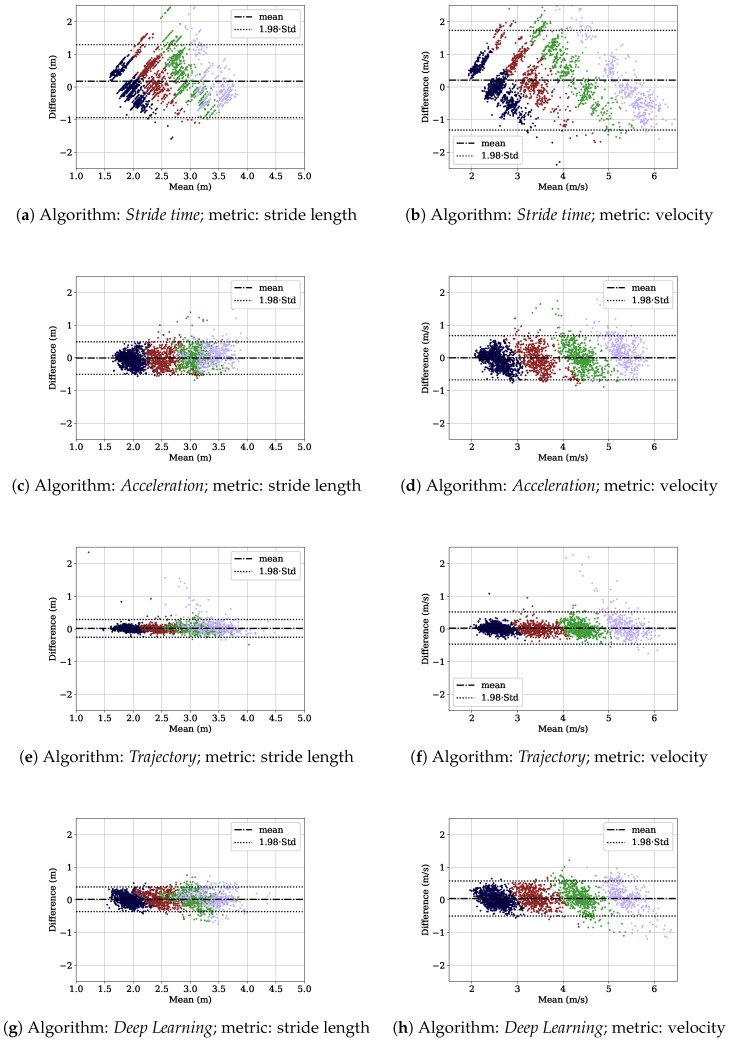
Figure 8.
Bland–Altman plots for stride length and velocity for the four algorithms. Each row contains the metrics for one algorithm. The individual samples are color coded depending on the velocity bin of the sample: 2–3 m/s blue, 3–4 m/s red, 4–5 m/s green, 5–6 m/s purple. The dotted-dashed horizontal lines depict the mean error and the dotted horizontal line the 95% confidence interval.

