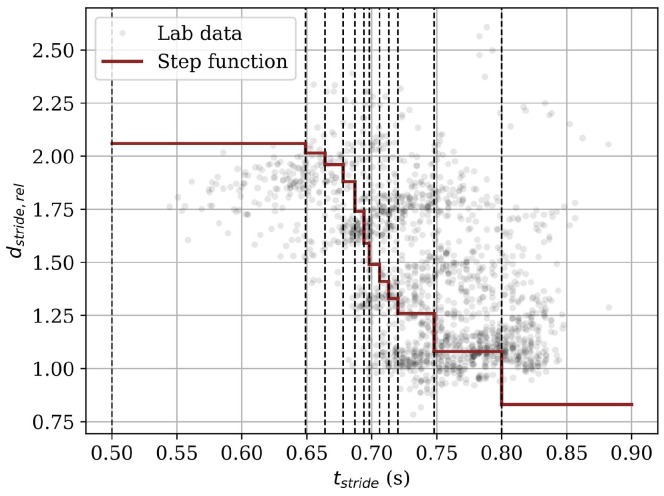
Figure 10.
Visualization of the correlation between the stride time and the relative stride length for male subjects. The light gray dots depict the data obtained from the field study, whereas the red curve and the black dashed lines visualize the step function obtained from literature and implemented in the Stride time algorithm.

