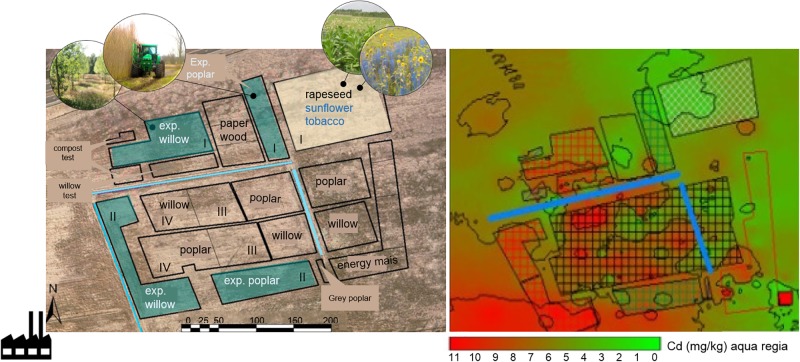
FIGURE 1.
Scheme of the experimental field site in Lommel, and overview of the total Cd concentrations. The location of the sunflower and tobacco plot (2012–2014) analyzed in this study is highlighted in yellow (block I). The installed experimental willow and poplar plots (blocks I, II) are indicated in blue, the commercial willow and poplar plots were located in blocks III and IV (Van Slycken et al., 2015). Total Cd concentration map is based on an aqua regia destruction of subsurface (0–30 cm) collected soils (n = 47, year = 2006) (Van Slycken et al., 2015).

