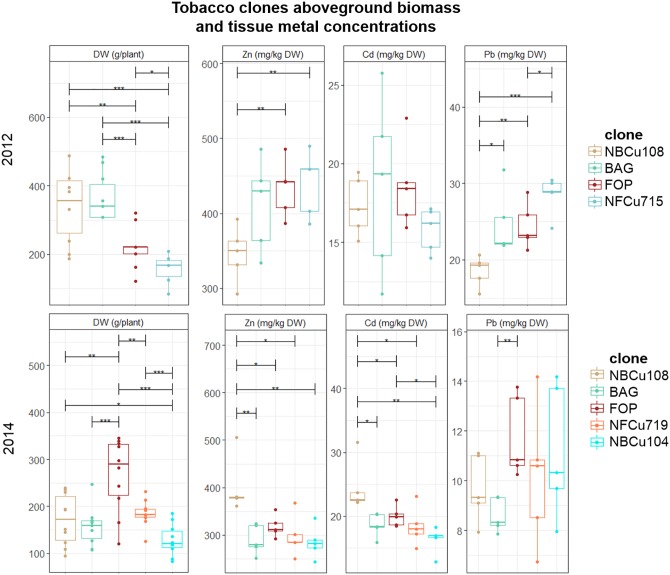
FIGURE 2.
Mean aboveground DW production per plant (g) of in vitro bred tobacco clones tested in 2012 and 2014. Error bars are SEs (n = 10). Different colors represent the different clone, ranked according to highest mean above-ground biomass per year. BAG is the mother clone of NBCu clones while FOP is the mother clone of NFCu clones. Stars represent significant differences at the level of p < 0.05 (∗), p < 0.01 (∗∗) and p < 0.001 (∗∗∗) between clones within a year (ANOVA, Tukey-HSD). No significant differences were detected between the years for each clone (t-test).

