Figure 2.

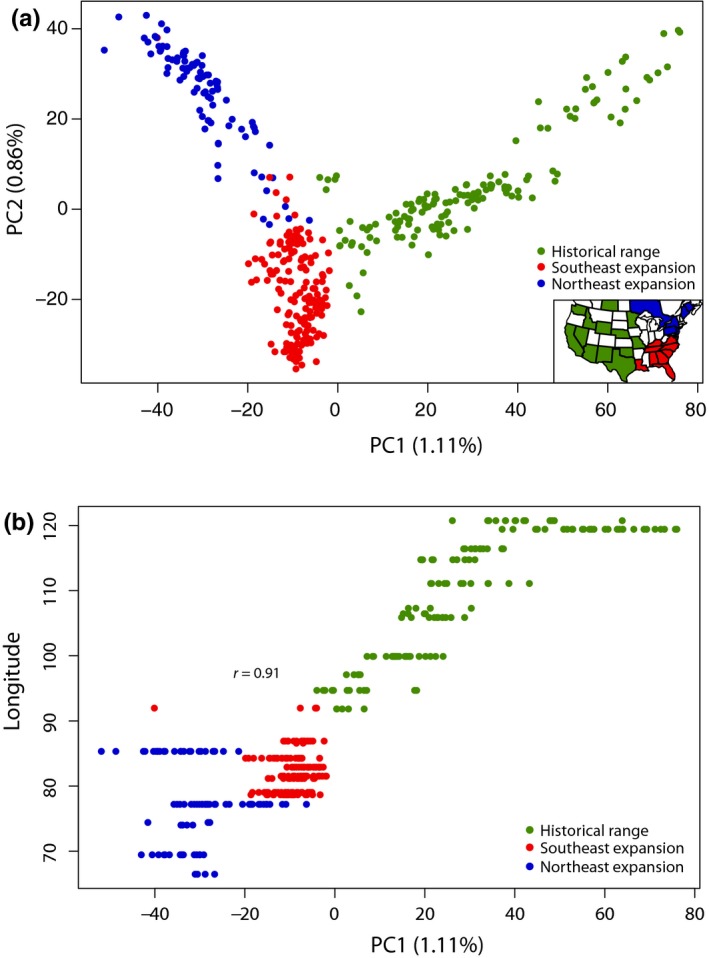
(a) Principal component analysis (PCA) of molecular data for all 394 coyotes. Insert: Geographic distribution of sampling locations. (b) Correlation between PC1 and longitude of sampling location (Pearson's r = 0.91: p < 2.2 × 10⁻¹⁶)

(a) Principal component analysis (PCA) of molecular data for all 394 coyotes. Insert: Geographic distribution of sampling locations. (b) Correlation between PC1 and longitude of sampling location (Pearson's r = 0.91: p < 2.2 × 10⁻¹⁶)