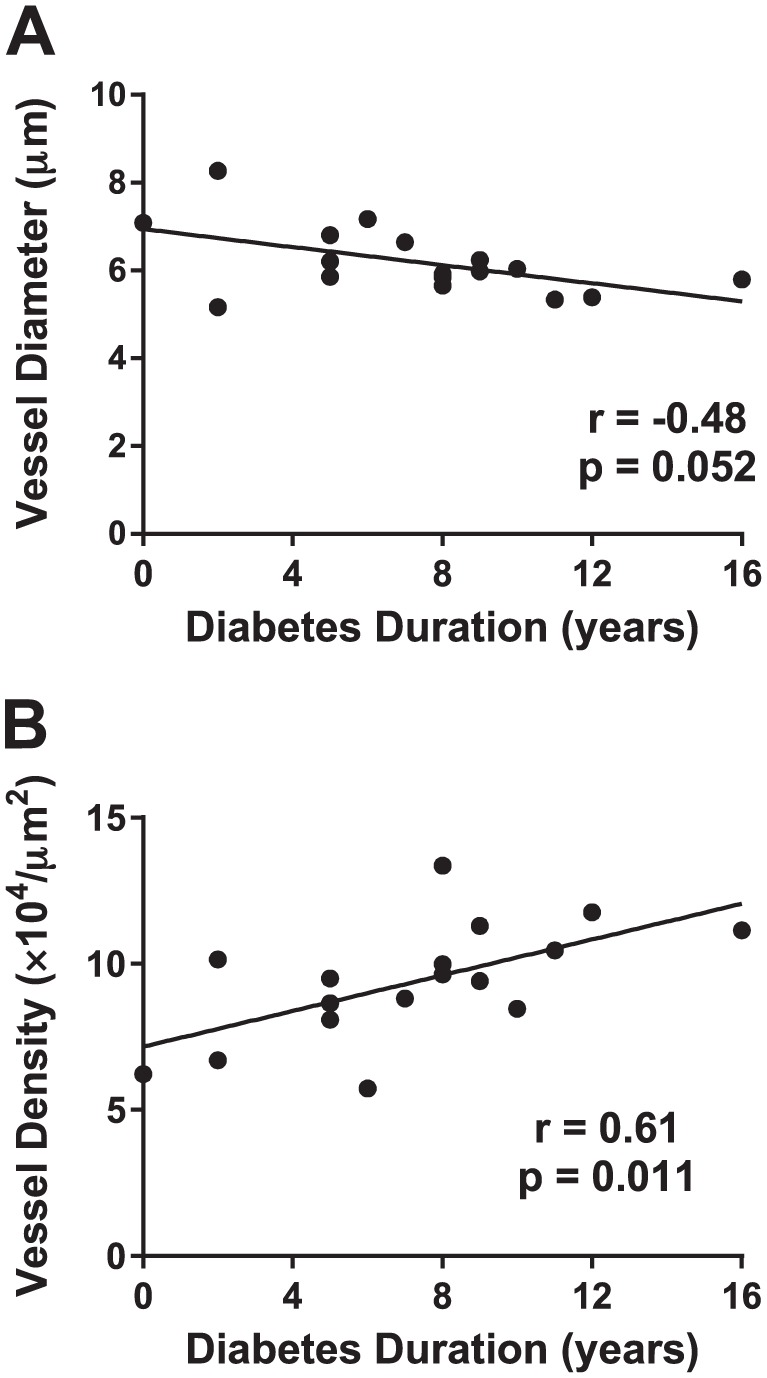
Figure 4.

Diabetes duration and islet vessel diameter and density. Sections were stained and image analysis performed as described in section “Materials and Methods” for 17 donors with type 1 diabetes (N=7–20 islets/donor). Islet vessel diabetes (A) and density (B) were plotted as a function of diabetes duration (years), and correlation analysis was performed using Spearman’s test with linear regression lines shown.
